
- Overview
- Logging in to Qualtrics
- Creating a Project
- Building the Survey
- Publishing the Survey
- Analysis & Report of the Survey
- Documentation of Features
- List of Question Types
- A/B Testing
- Building Consent Form
- Survey Tips, Learning Course & Training for Qualtrics


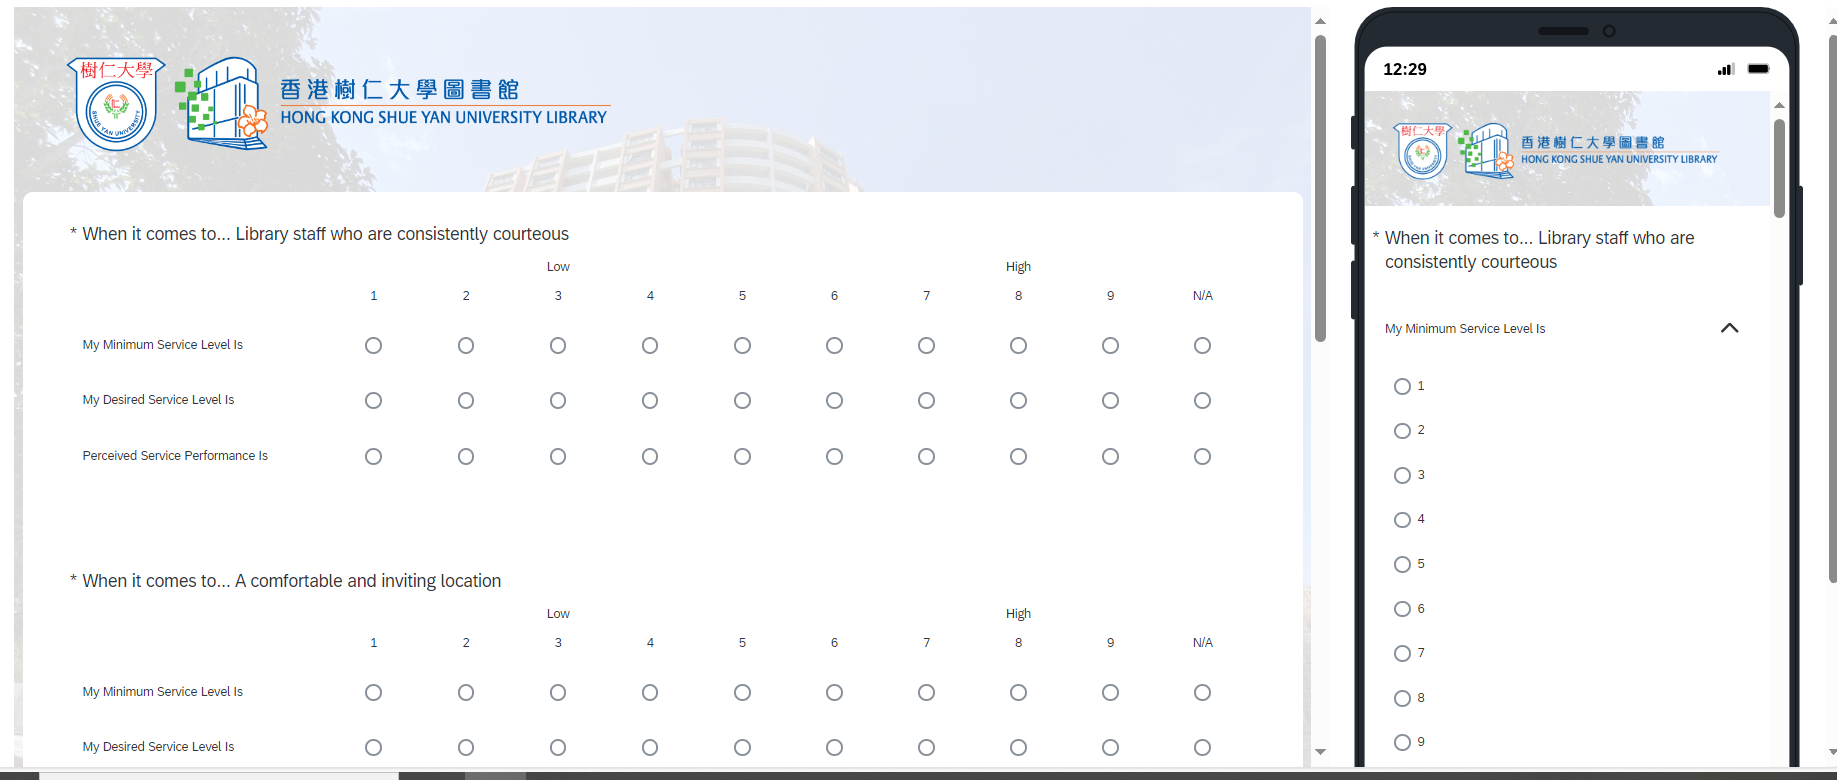
Qualtrics is an advanced web-based survey software for research. It serves as a survey tool for designing and distributing surveys online, catering to various purposes such as event registrations, evaluations, user satisfaction assessments, and academic research surveys.
It offers robust analytics and real-time data tracking features, significantly simplifying the process of collecting and analysing survey data.
Features of Qualtrics
Qualtrics offers a wide range of features to support survey creation, distribution, and analysis, including:
- Extensive Question Types and Templates:
Access over 100 question types and a variety of ready-to-use survey templates to suit different research needs. - Question Import Functionality:
Import questions from previously created surveys, allowing you to reuse content without rewriting from scratch. - Test Response Generation:
Generate test responses to preview and validate your survey before distribution. - Advanced Analytics and Predictive Intelligence:
Take advantage of built-in predictive intelligence (Predict iQ) and advanced statistical analysis tools (Text iQ, Stats iQ & Crosstabs) to uncover valuable insights from your data. - ExpertReview:
Receive real-time feedback on each question and design improvement recommendations to enhance survey response rates and data quality. - Easily Shareable Reports:
Choose from over 30 graph types, share your findings online, or export your data in formats such as DOC, PDF, CSV, or PowerPoint.
First-Time Login
Visit https://hksyu.au1.qualtrics.com/login and log in using your Moodle username and password.

 28065113

Features of Qualtrics
Qualtrics provides a variety of features related to surveys, including:
- Over 100 question types and ready-to-use survey templates are provided.
- You can import questions from previously made surveys and use them in your new survey instead of writing them from scratch.
- You can generate test response for the survey.
- It has built-in predictive intelligence (Predict iQ) and statistical analysis features (Text iQ, Stats iQ & Crosstabs) to uncover new insights.
- ExpertReview provides real-time feedback on each question and offers design improvement recommendations to enhance survey response rates and data quality.
- Easily shareable reports: You have the option to choose from over 30 graph types, share your findings online, or export your data in formats such as DOC, PDF, CSV, or PowerPoint.
First-Time User
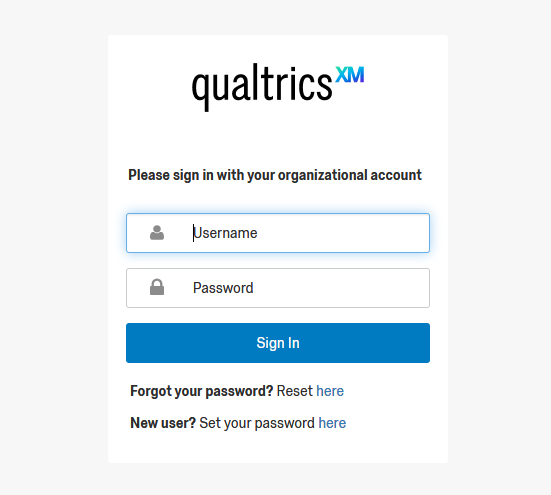
1. Visit the login page: https://hksyu.au1.qualtrics.com/login
2. Log in with your Moodle username and password.
3. Select “No, I don’t have a preexisting account here”.
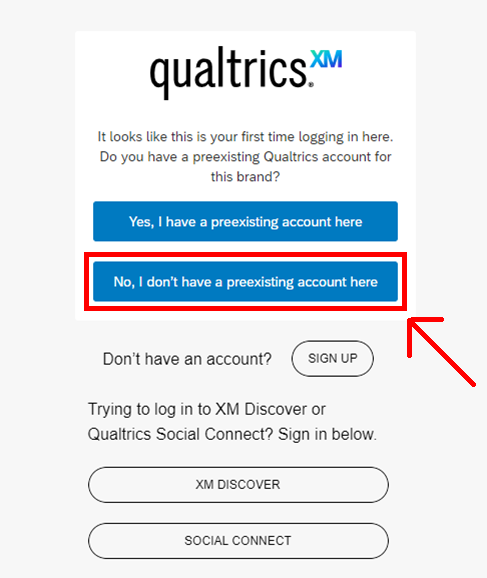
4. Your Qualtrics account will be created using the login information from your Shue Yan webmail or Moodle. When finished, click “Sign in”.
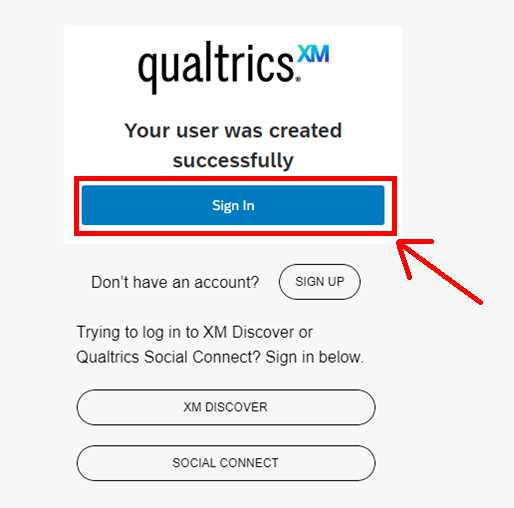
5. Read the “Terms of Service or General Terms and Conditions for Qualtrics Services (GTC)" and select “I accept”.
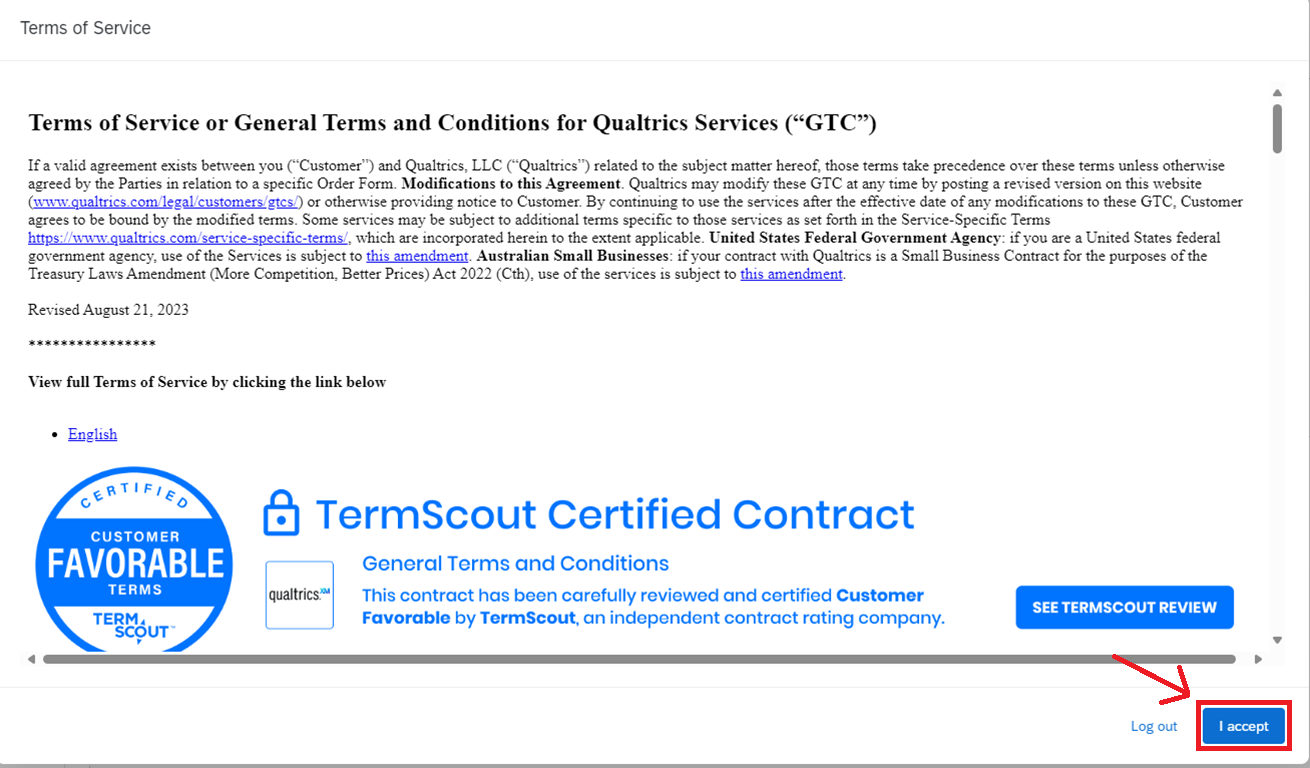
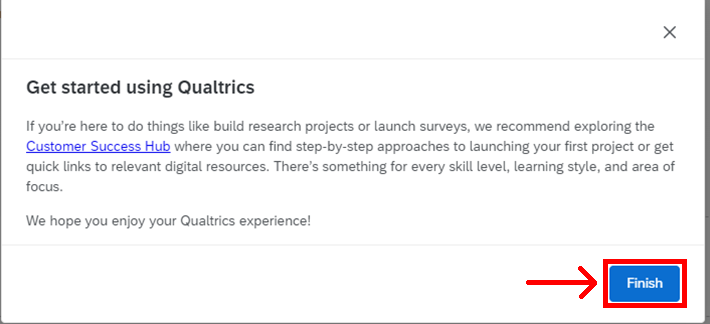
6. Click “Get started”.
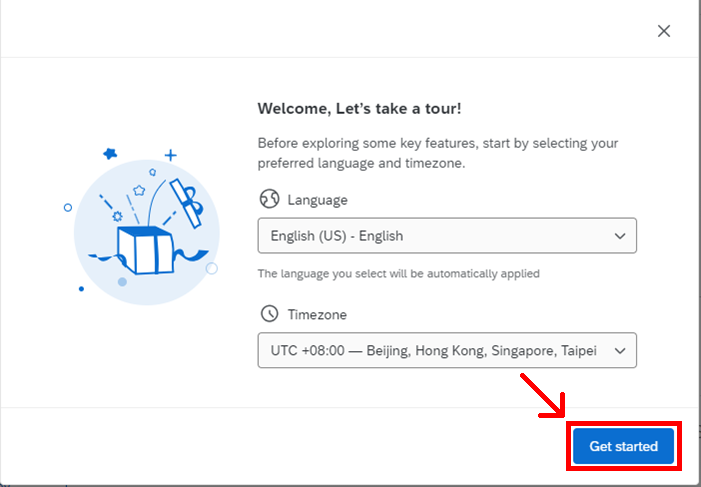
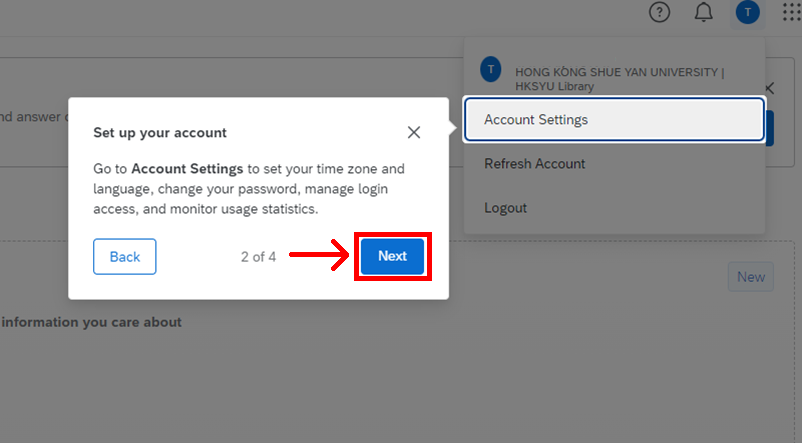
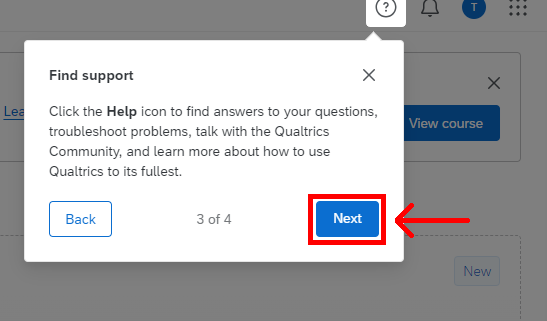
For the first-time login, you may follow the quick guide below:
Existing User
1. Access the link: https://library.hksyu.edu/lib/
2. Click on “e-Resources A–Z”, then select “Q”.
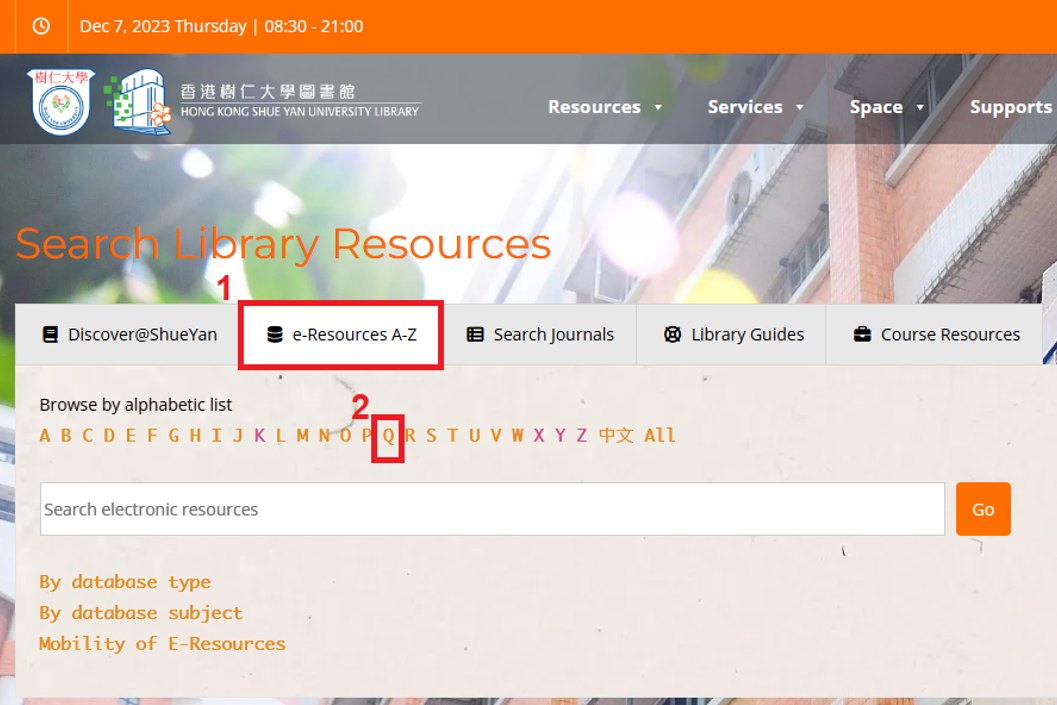
3. Click “Qualtrics” to open the login page.
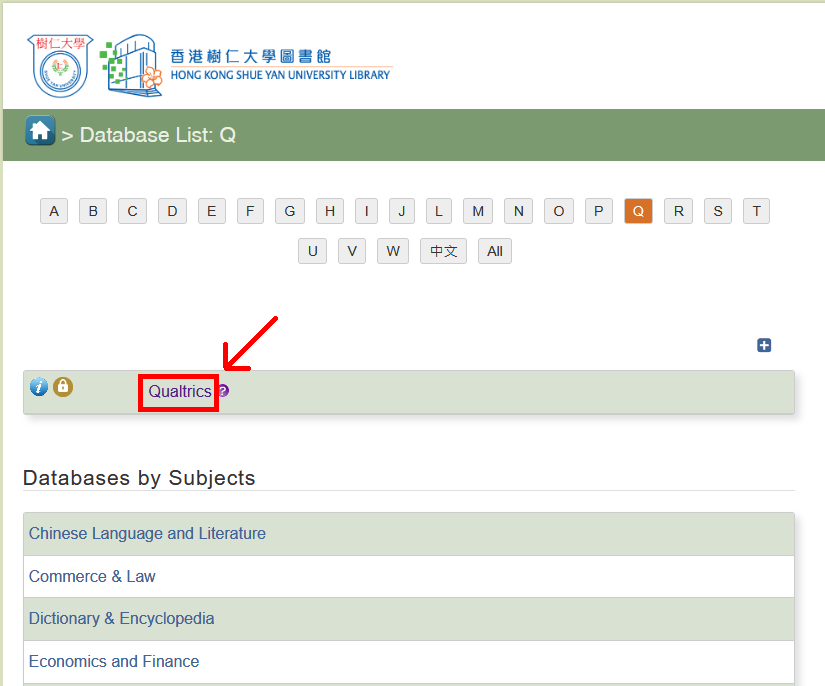
4. Log in with your Moodle username and password, then click "Sign In".
5. You will be logged in to your Qualtrics account.
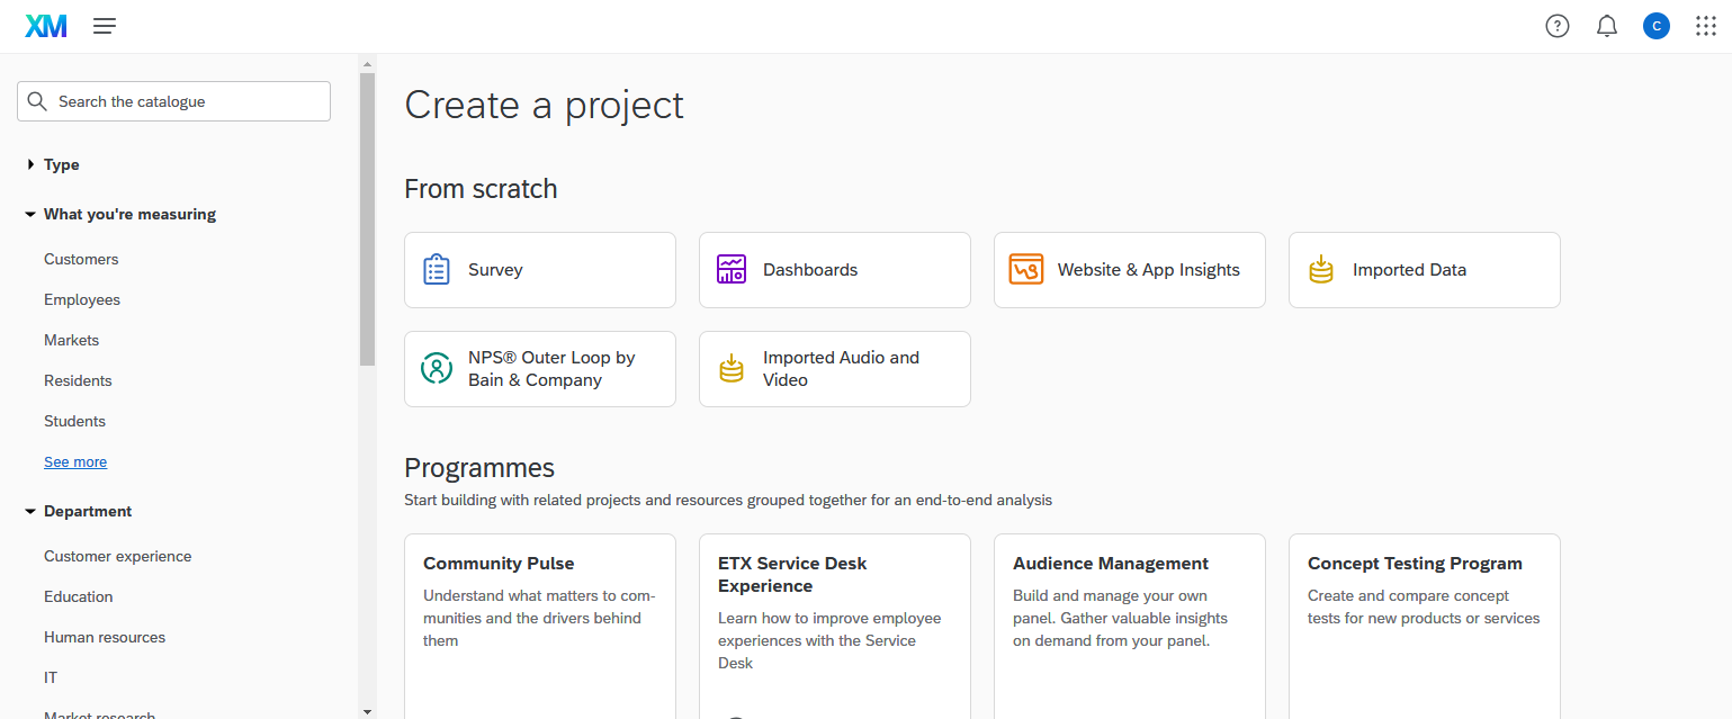
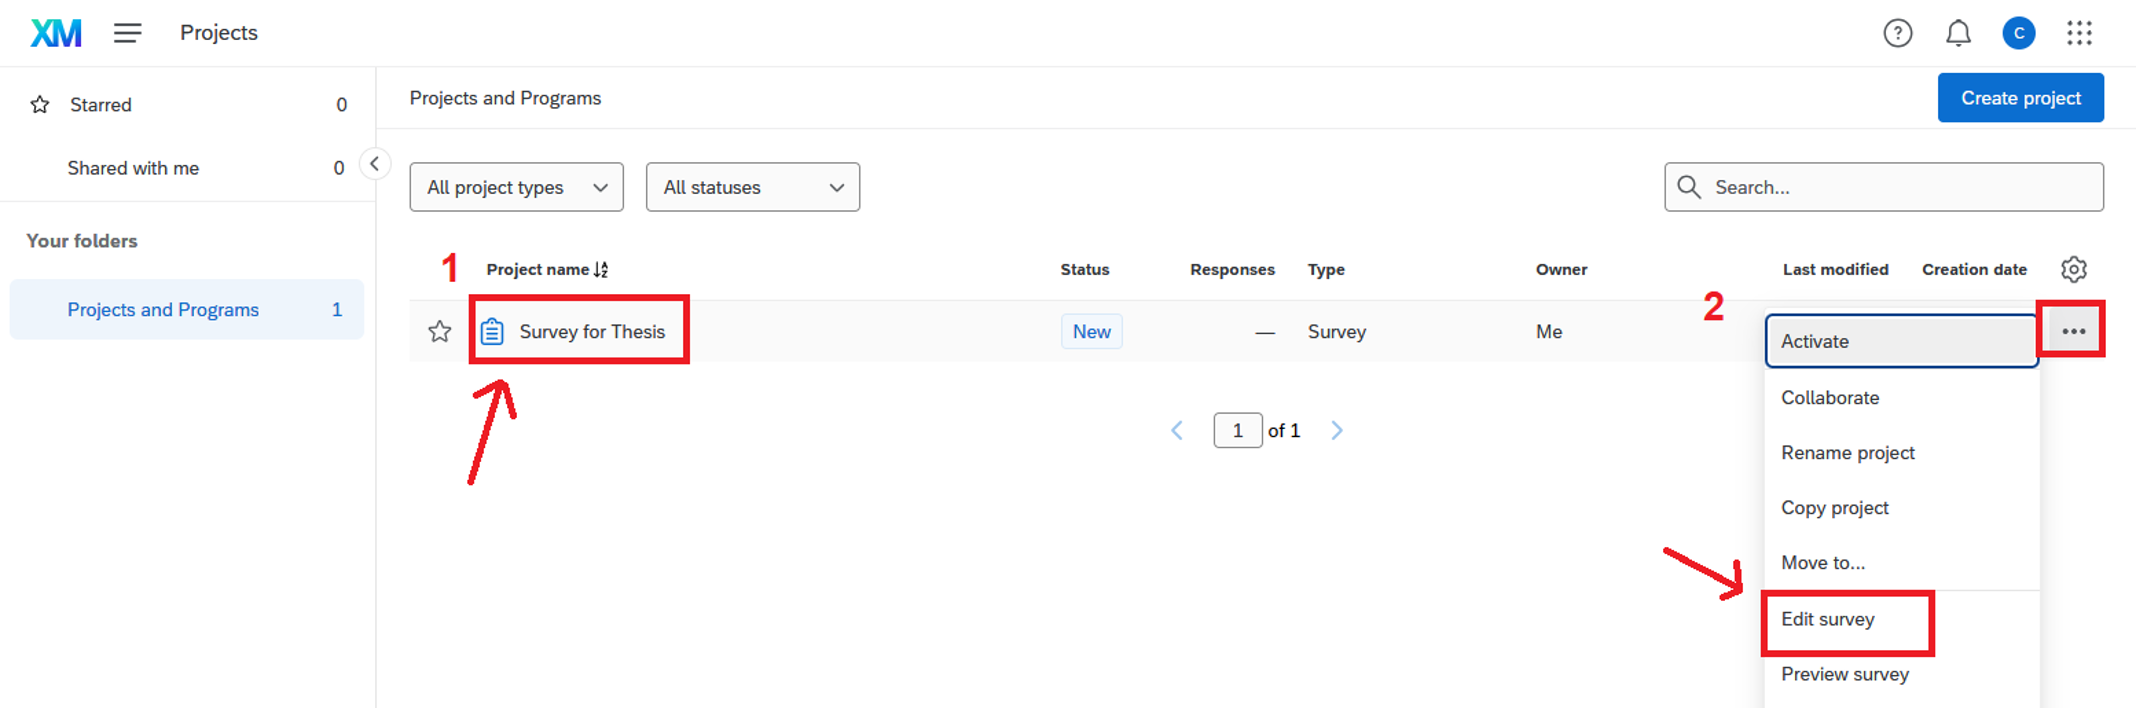
Creating a New Project
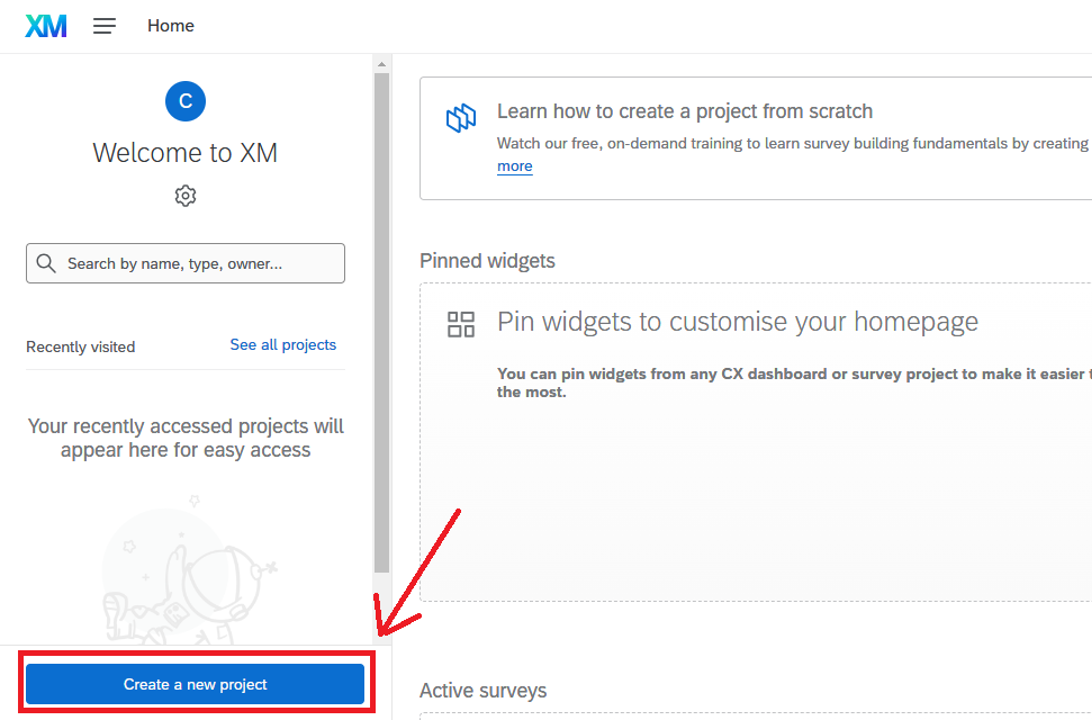
1. To easily manage your surveys in the future, you will need to create a project.
2. Click “Create a new project”.
3. Here, you may choose to start from scratch or start from a Qualtrics template.
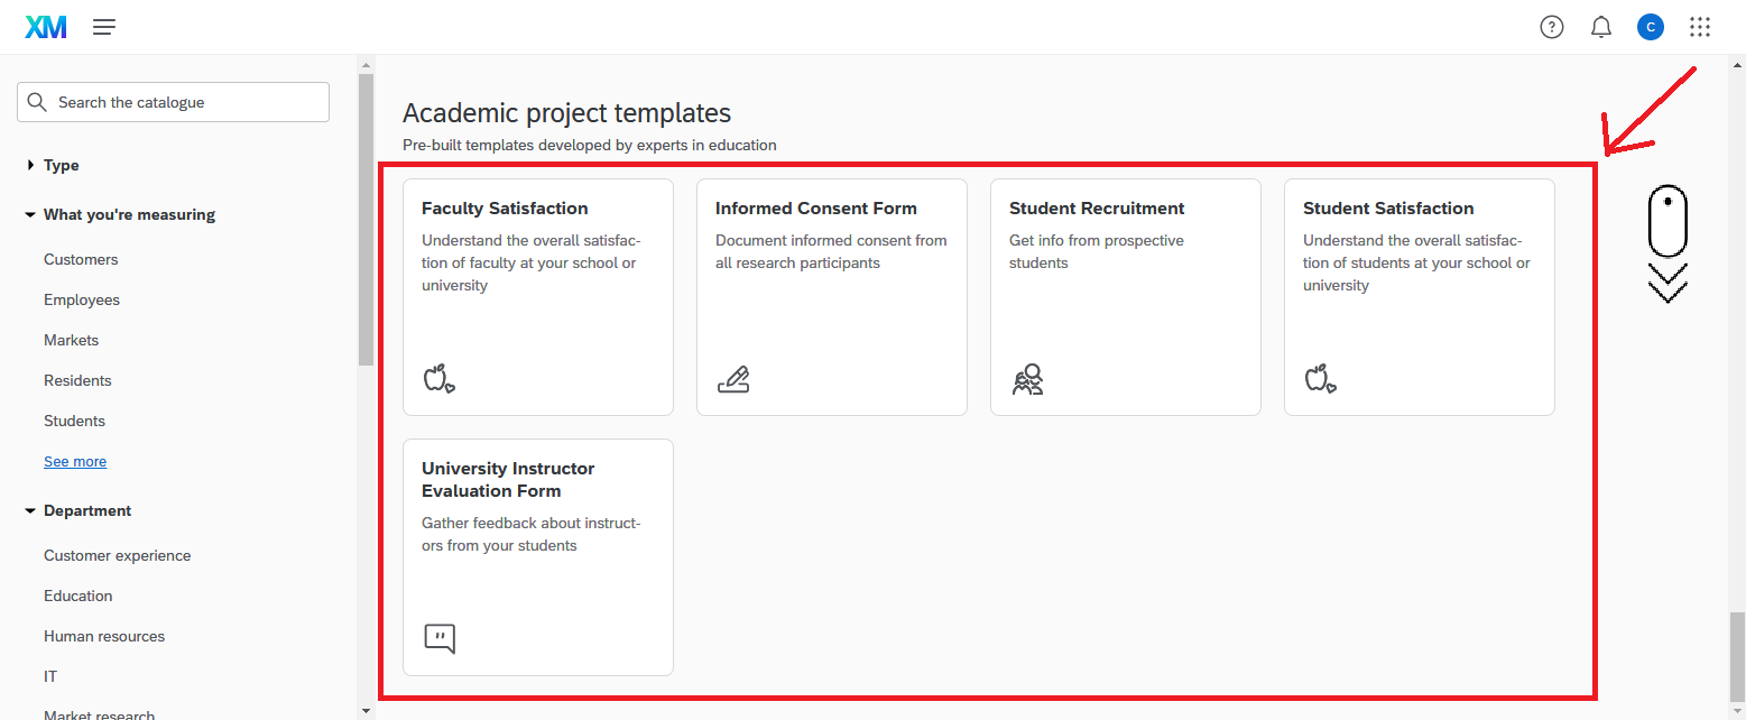
Starting from a Qualtrics Template
Scroll down the page and select a template from “Academic project templates” for a quick start.
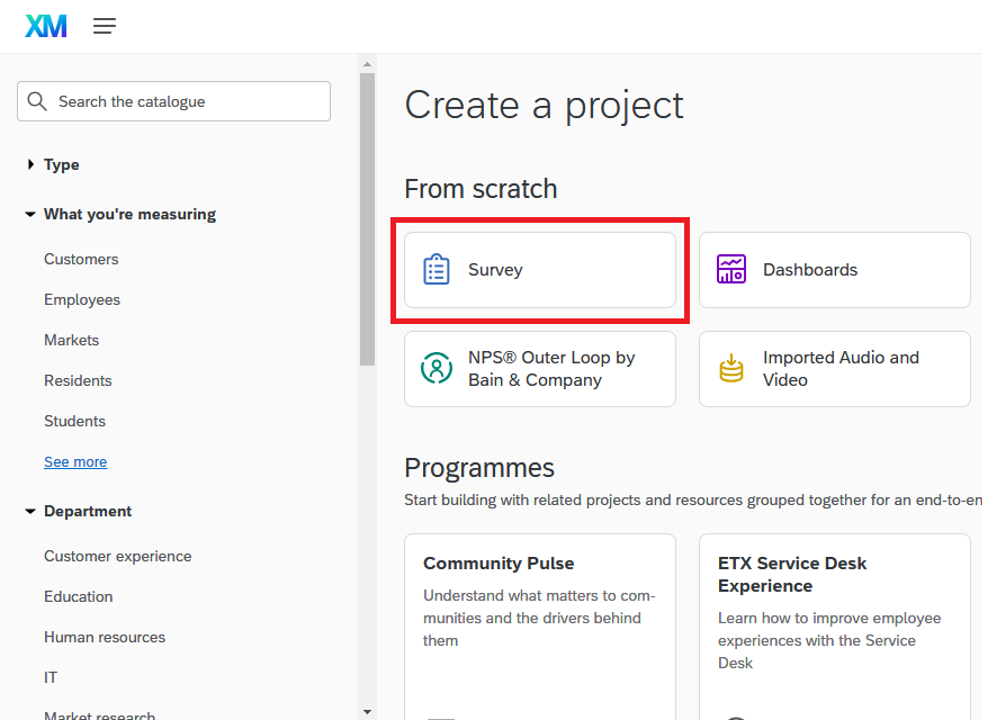
Starting from Scratch
1. To start from scratch, click “Survey” button.
2. Then, click “Get started”.
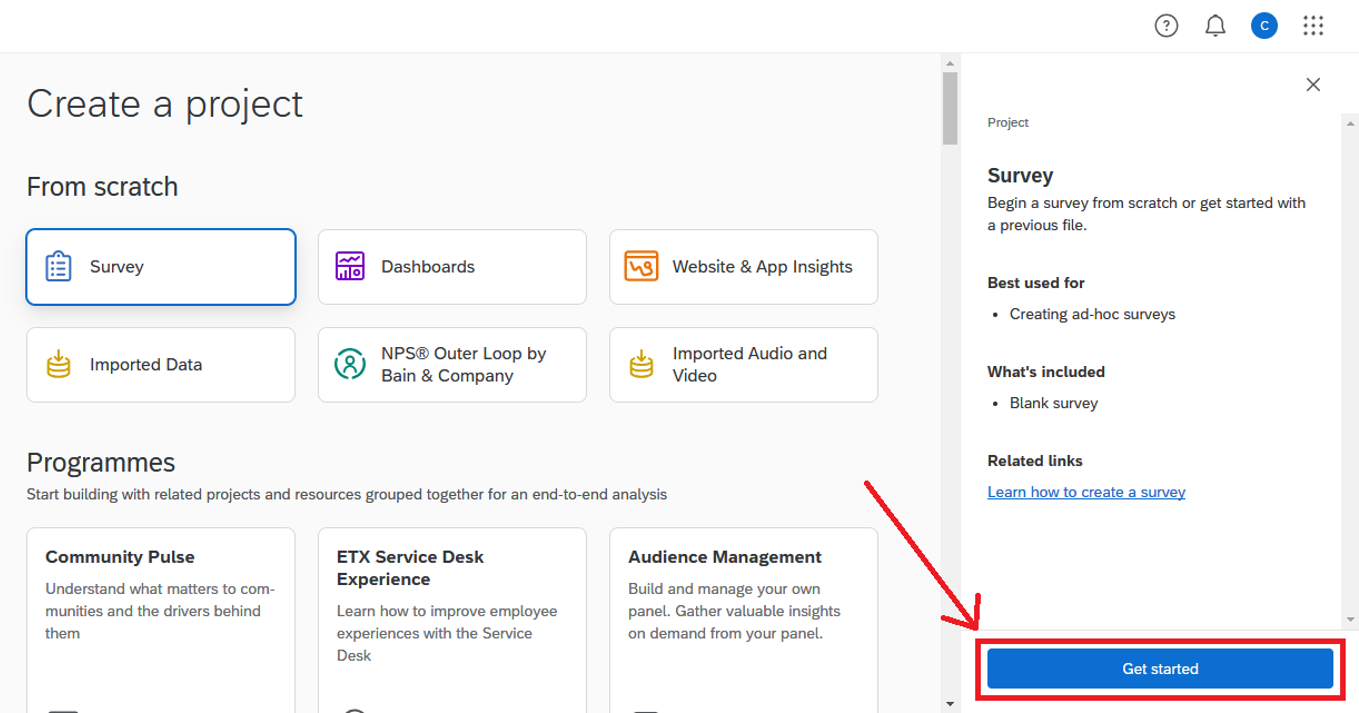
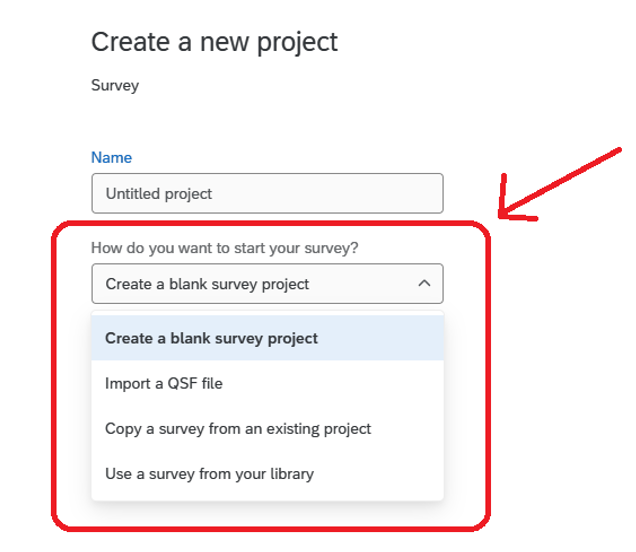
3. You will now have several options for starting your survey, including:
- Create a blank survey project
- Import a QSF File (Exported Qualtrics Survey Format (QSF) file)
- Copy a survey from an existing project
- Use a survey (template) from your library
Starting from a Blank Survey Project
1. Enter a name for your project, then click “Create project”.
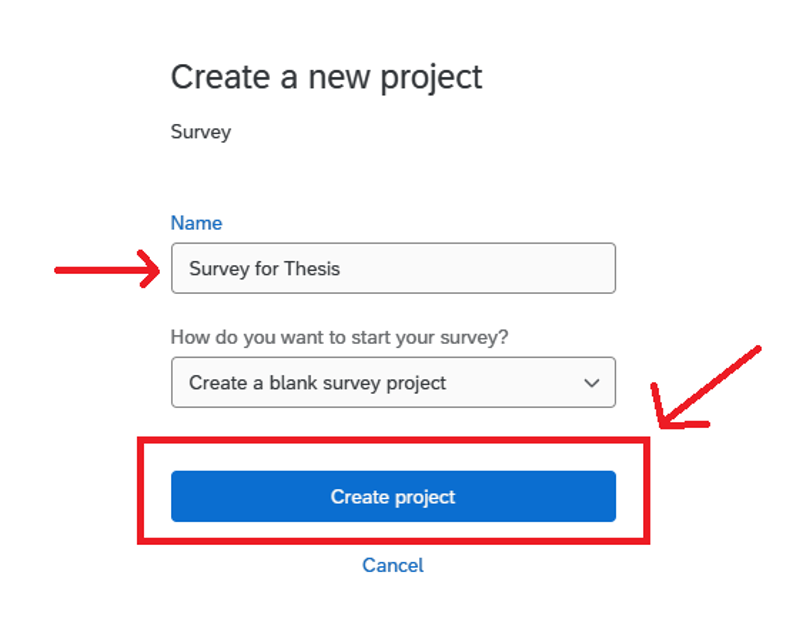
2. You will be taken to the Edit Survey page, where you can begin adding questions to your survey.
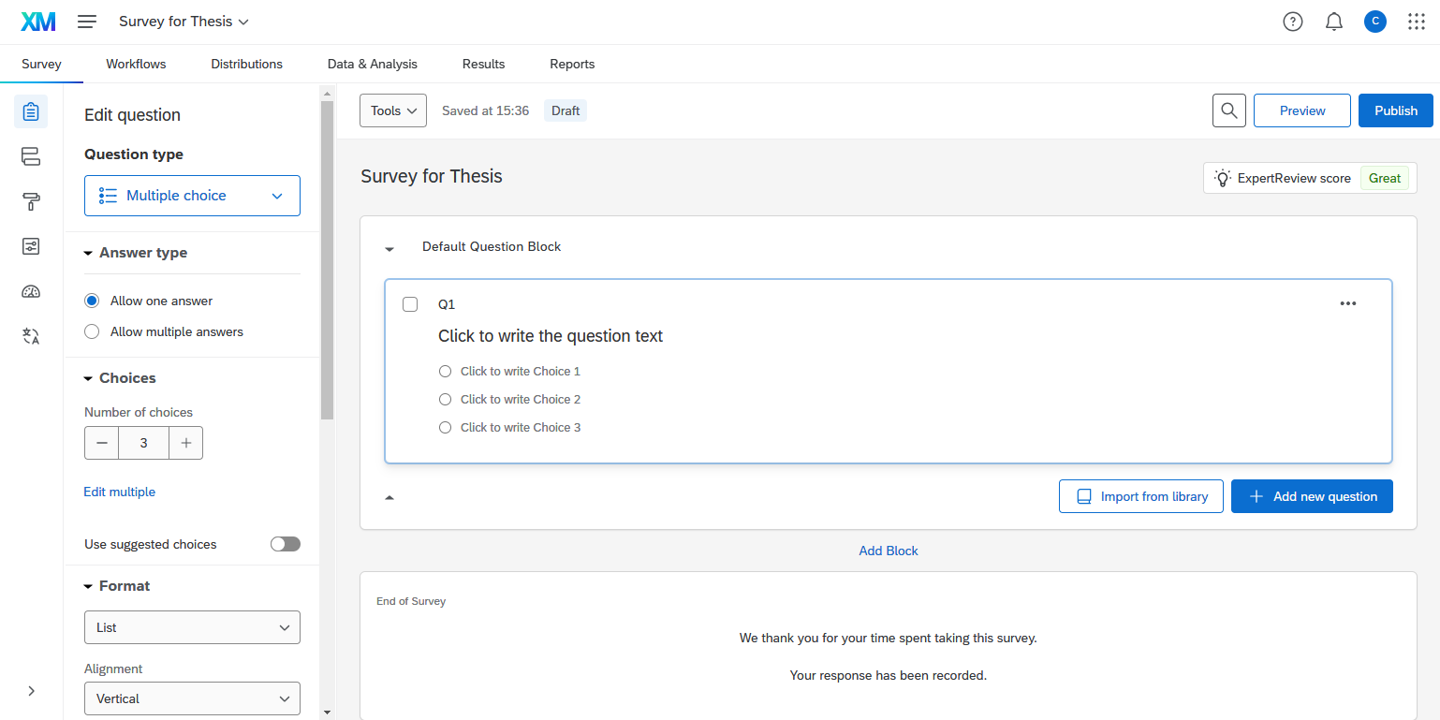
Adding a Question
1. Click the “+ Add new question” button at the end of your survey.
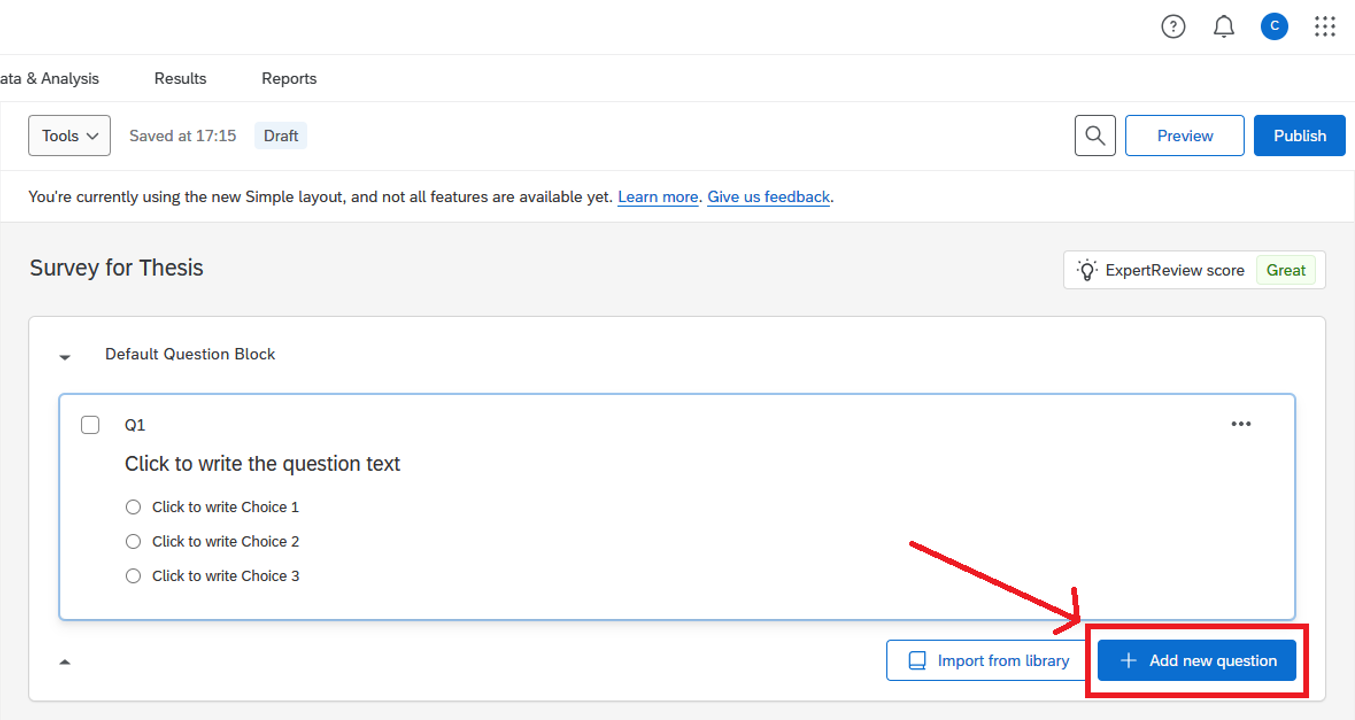
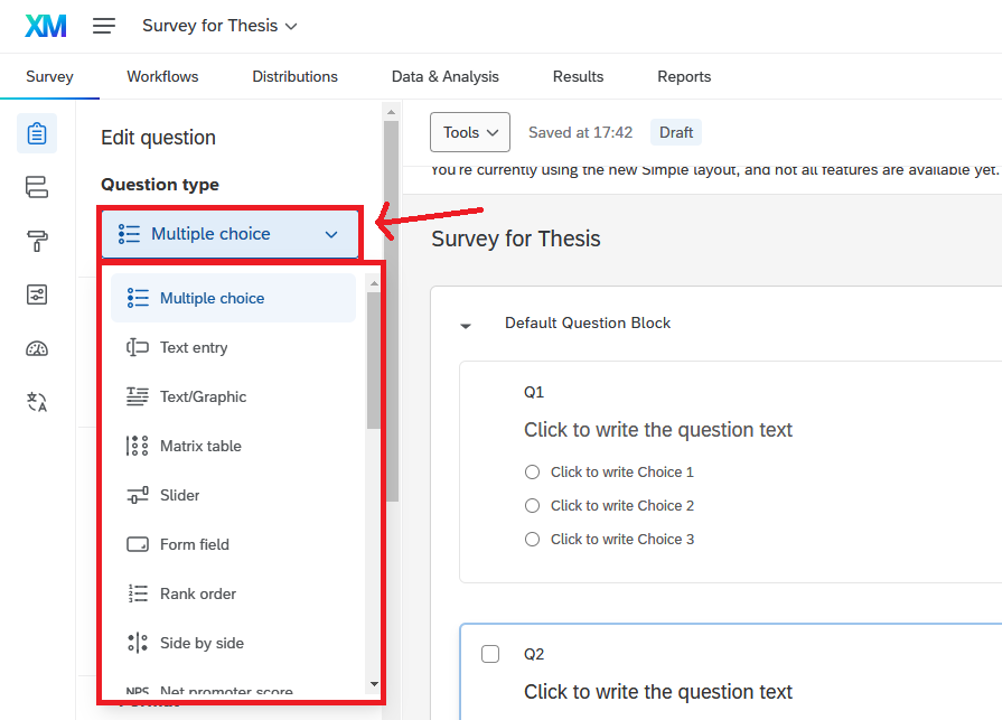
2. A dropdown will appear. Select the desired question type from the dropdown.
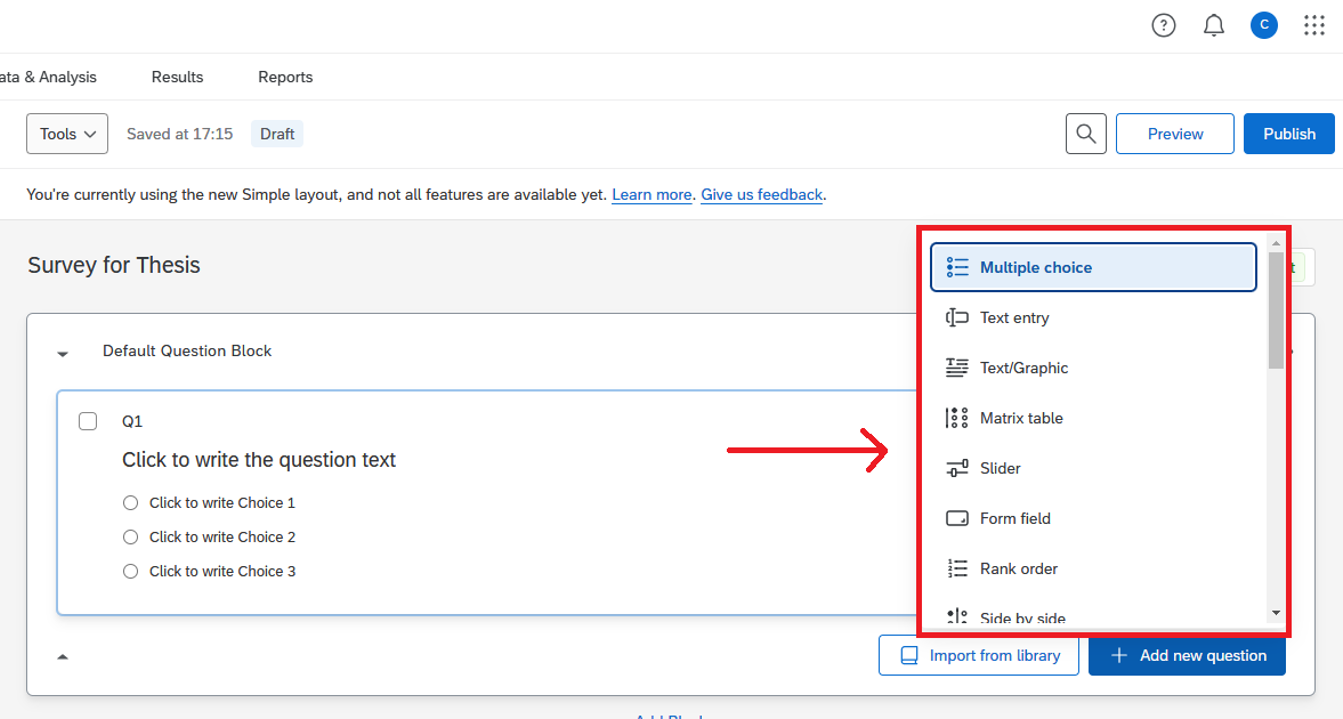
3. The selected question type will be added to the survey.
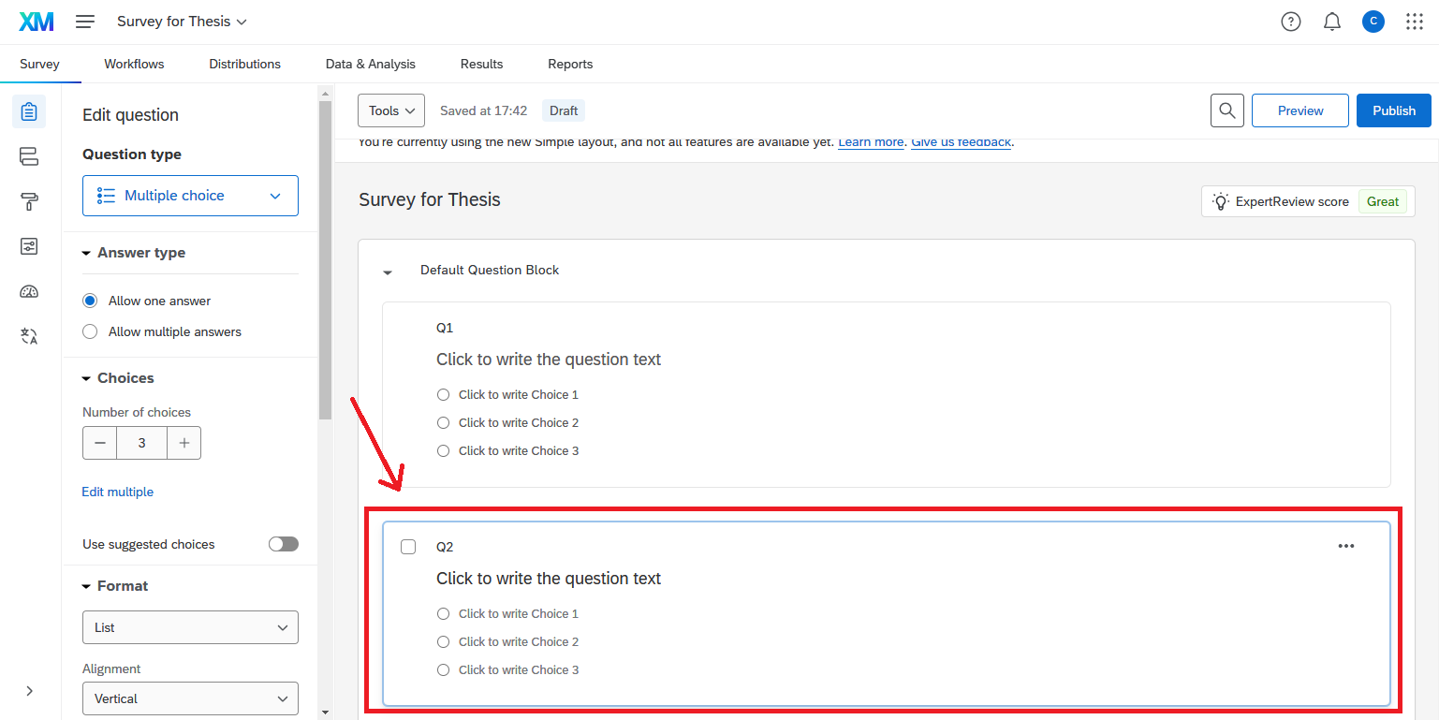
Changing the Question Type
If the question type is not what you need, you can change it by clicking the question type dropdown at the Edit Question pane on the left-hand side.
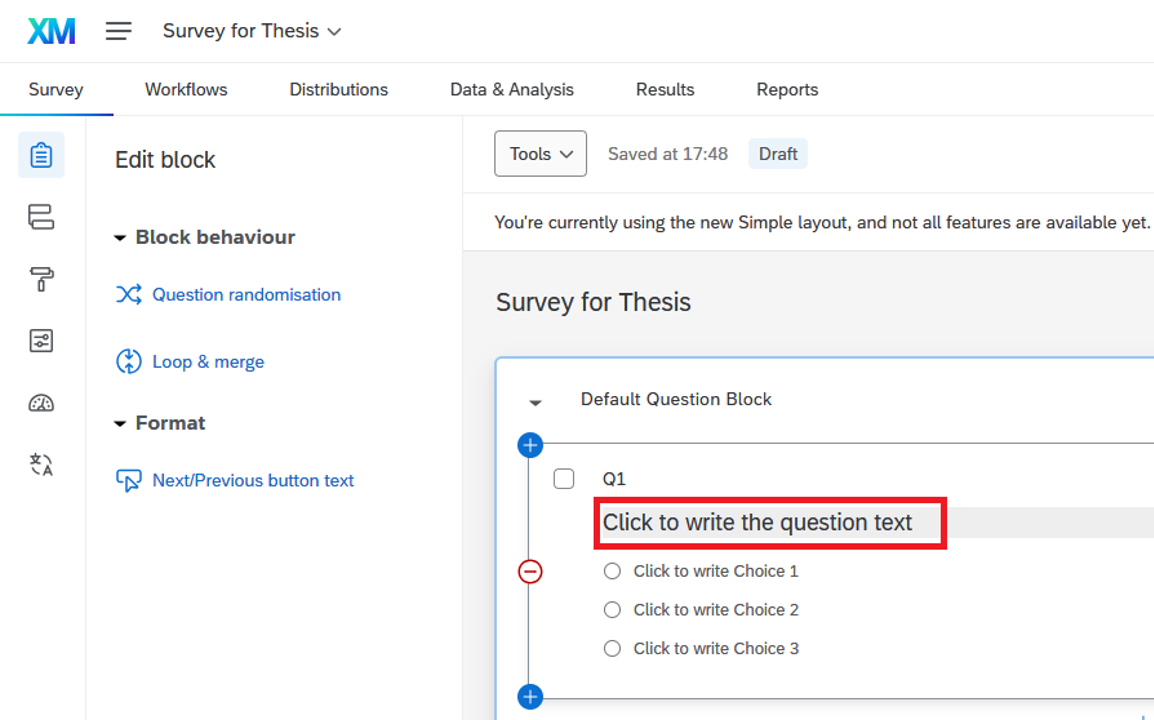
Editing a Question
1. Click on the area labelled “Click to write the question text” to enable the text editor and edit the question text.
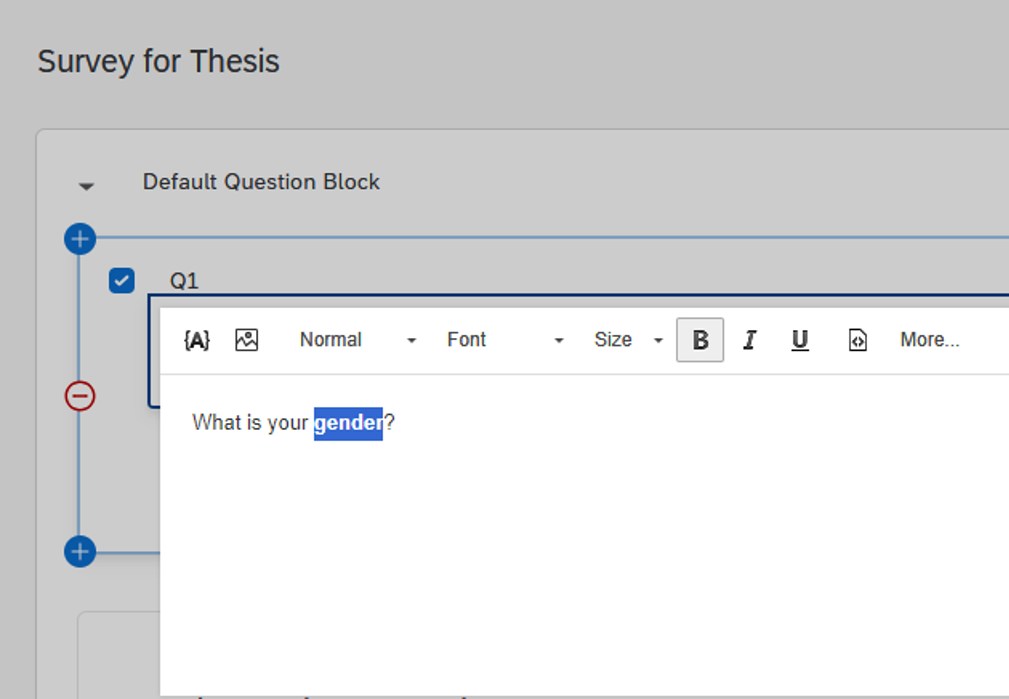
2. To format the question text, click the “Rich Content Editor…” button.
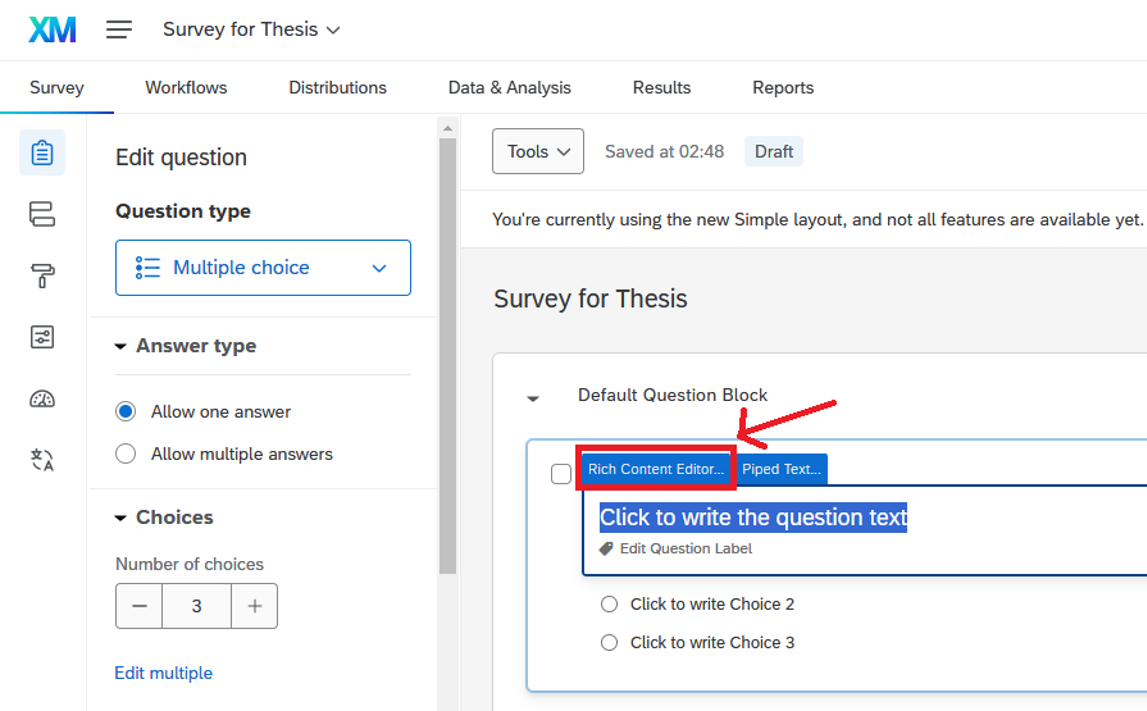
3. Format the text as desired, then click anywhere outside the text editor to close it.
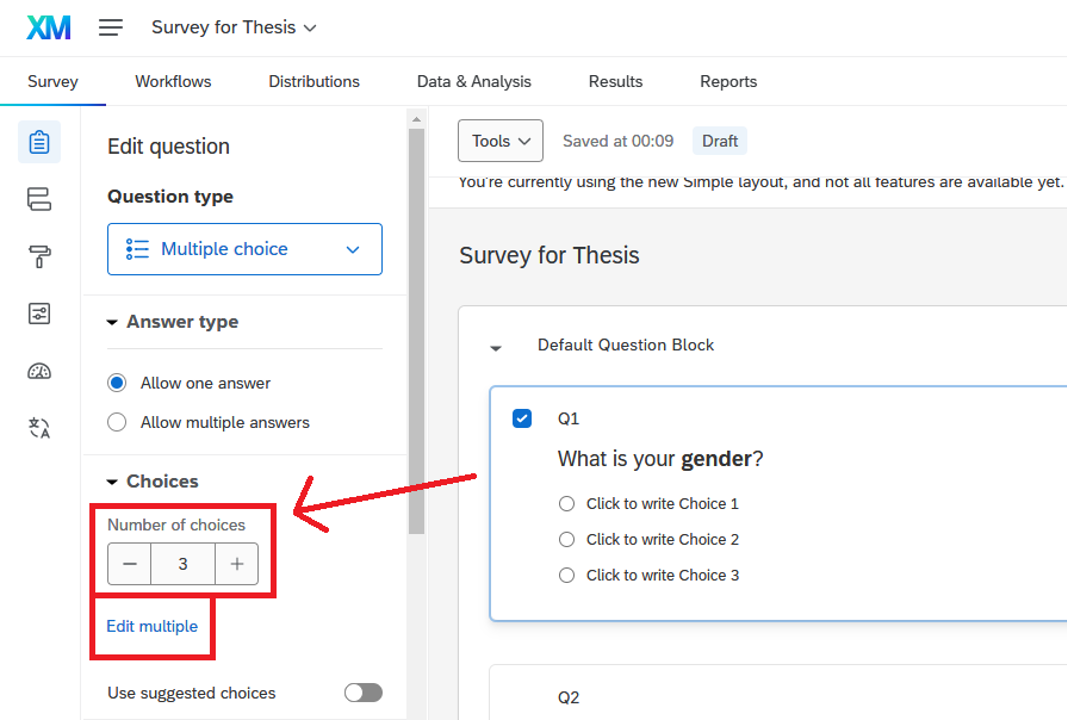
Number of Choices
A multiple-choice question will have 3 answer options by default. You can change the number of choices and edit them to suit your needs.
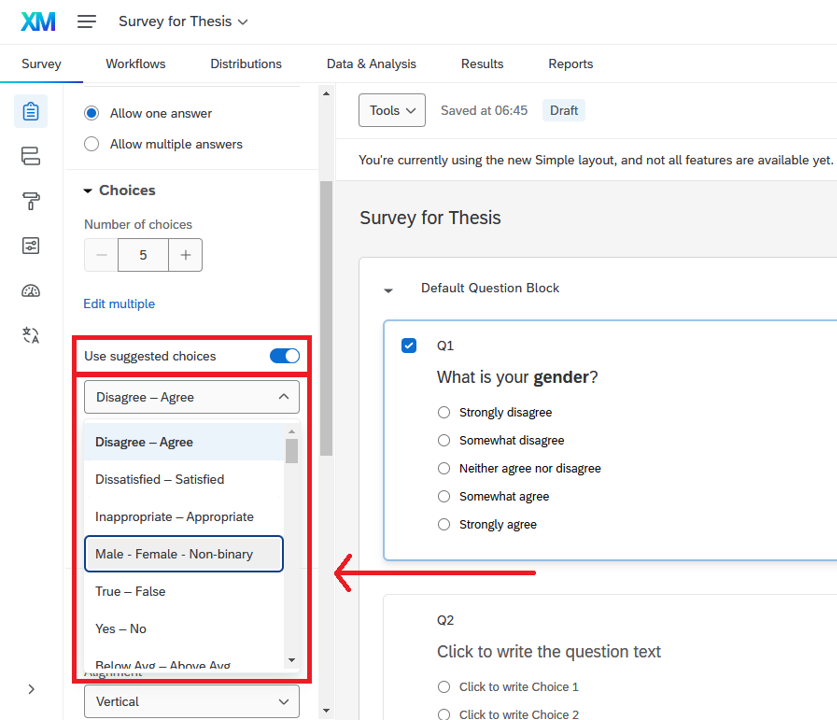
Use Suggested Choices for your Question
Enable “Use suggested choices” in the Edit Question pane. Then, click the dropdown below and select an appropriate answer type from the list of choices for your question.
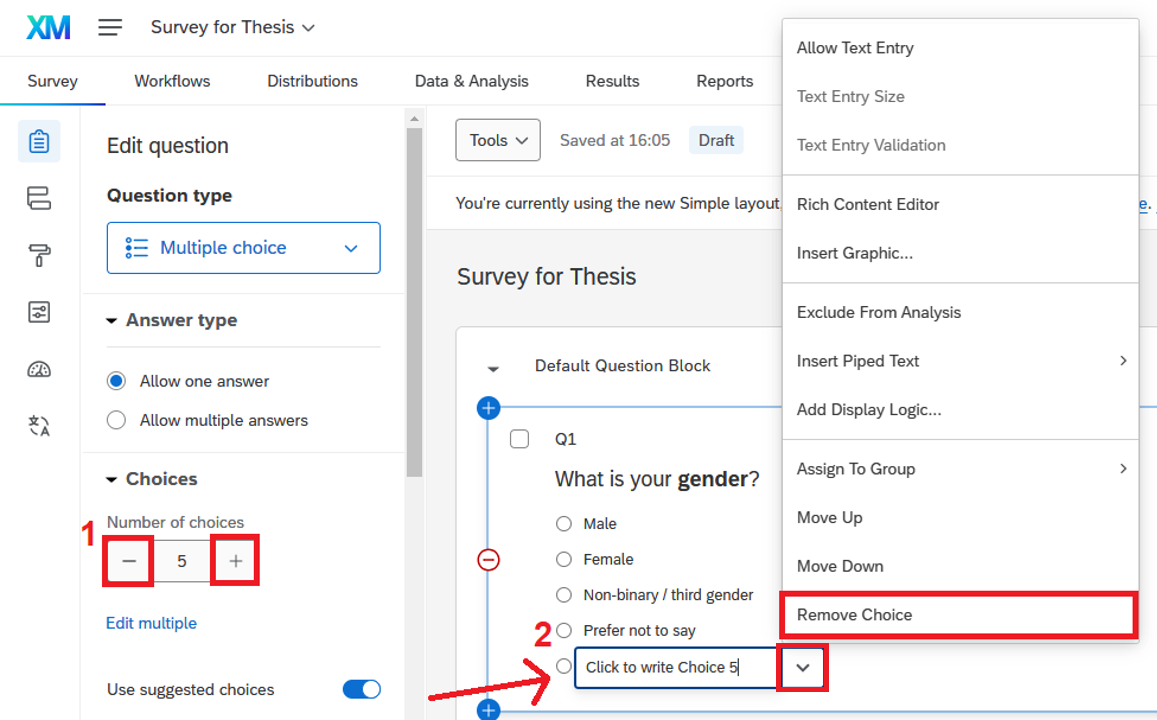
Adjusting the Number of Choices
You can manually add or remove answer options by clicking the plus (+) or minus (–) icons next to the choices in the Edit Question pane.
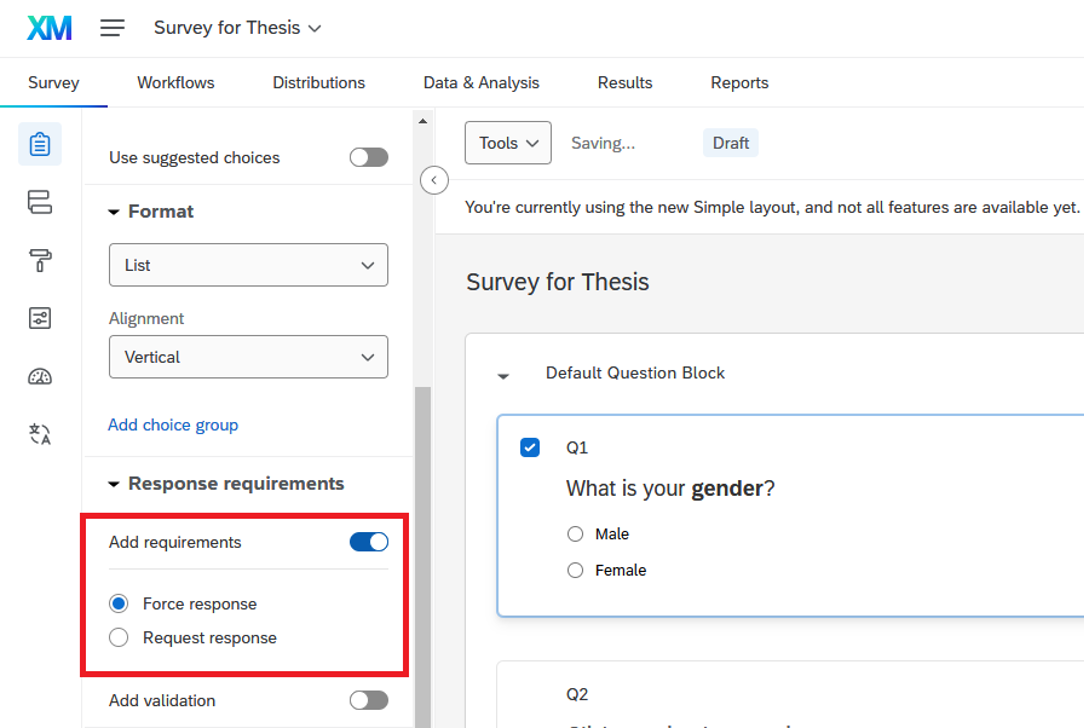
Forcing a Response to a Question
Enable “Add requirements” in the Edit Question pane and check the “Force Reponse” checkbox to require the respondents to answer the question before they can continue the survey.
Requesting a Response to a Question
Enabling “Request Reponse” checkbox will alert the respondents about any unanswered questions, but will allow them to continue the survey without answering if they choose.
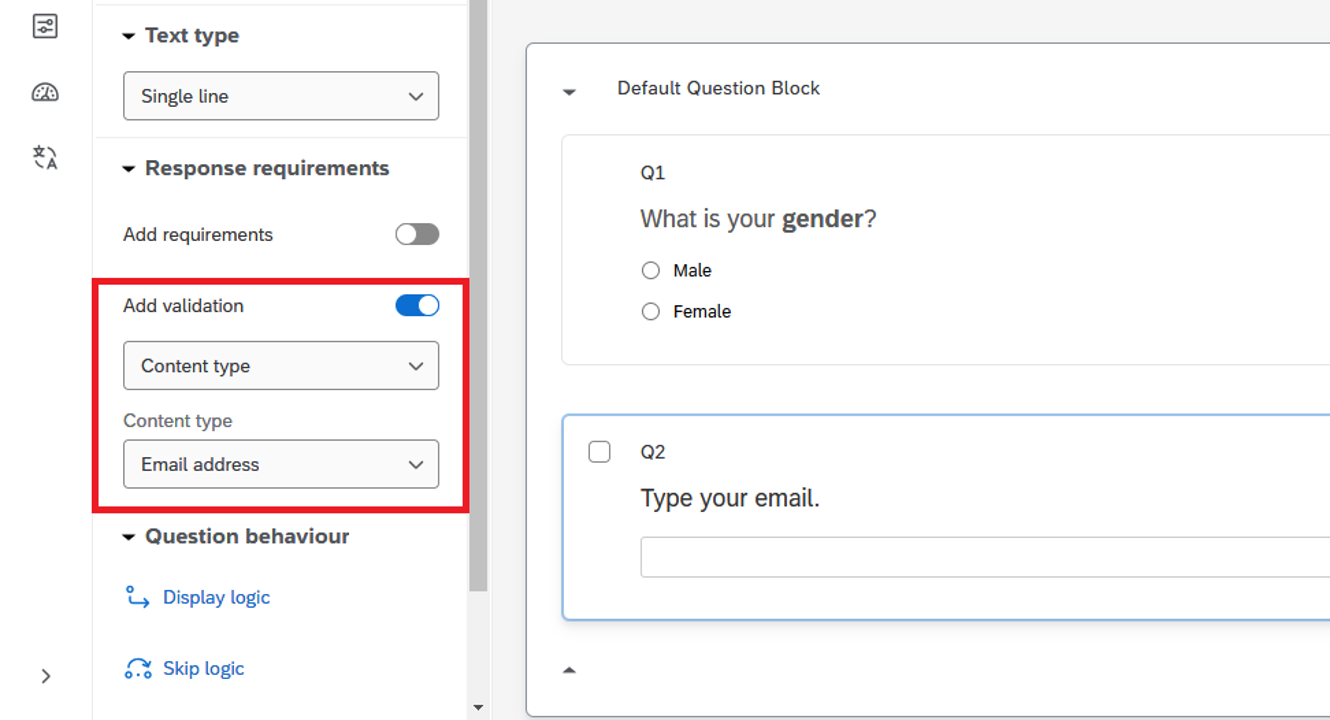
Validating the Answer to a Question
Enable “Add validation” in the Edit Question pane and select the appropriate criteria to suit your needs (e.g., you may require the answer to be an email, text, number, or a number within a specific range).
Note: The options available in "Add validation" depend on the question type you select.
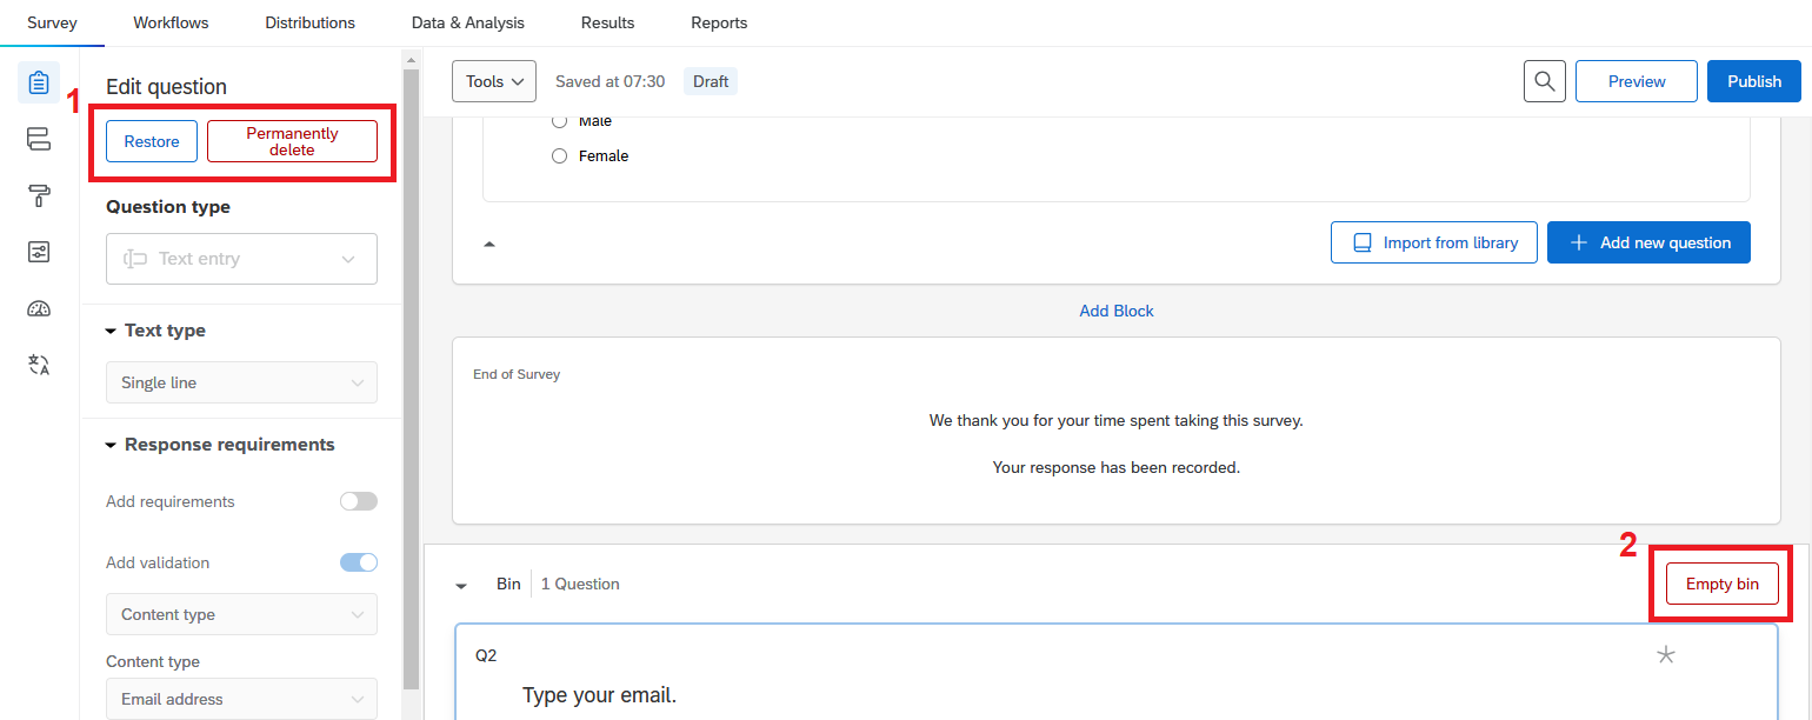
Deleting a Question
1. Hover the mouse on the question, click the red minus (Remove Question) button.
2. Otherwise, you can click the “…” button and select “Delete” to delete the question.
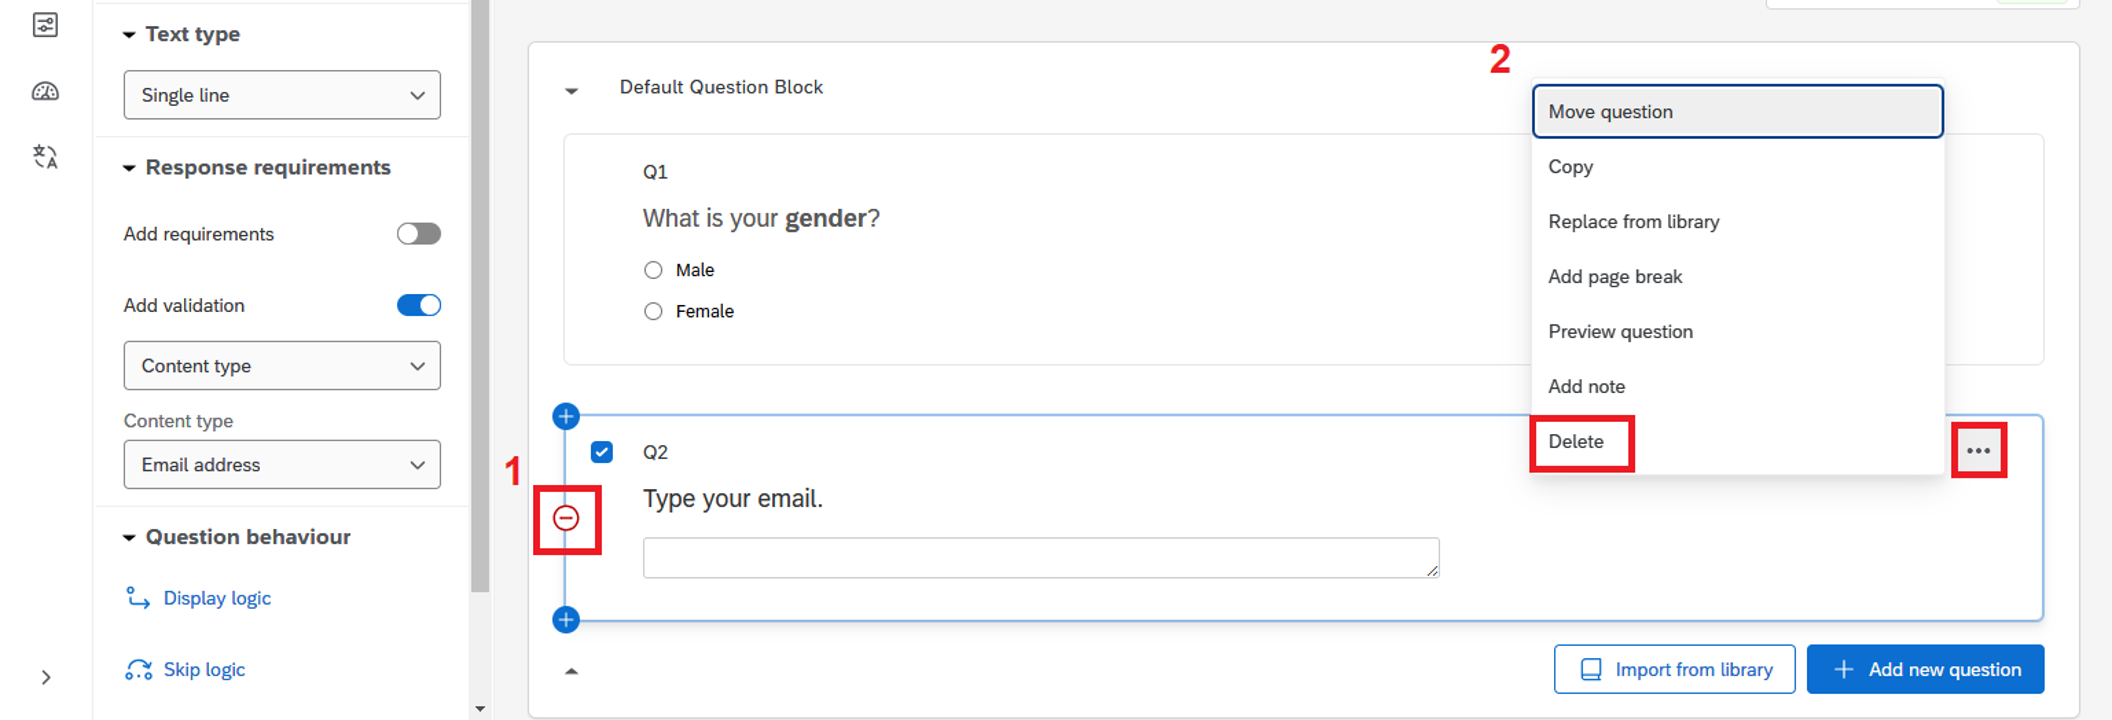
3. Scroll down and you will see the question will be moved to the Bin at the bottom of the page.
4. Select the question. Click the “Permanently delete” button at Edit question pane to remove the question from the bin, or click the “Restore” button to recover the question, or click “Empty bin” to remove all the question from the bin.
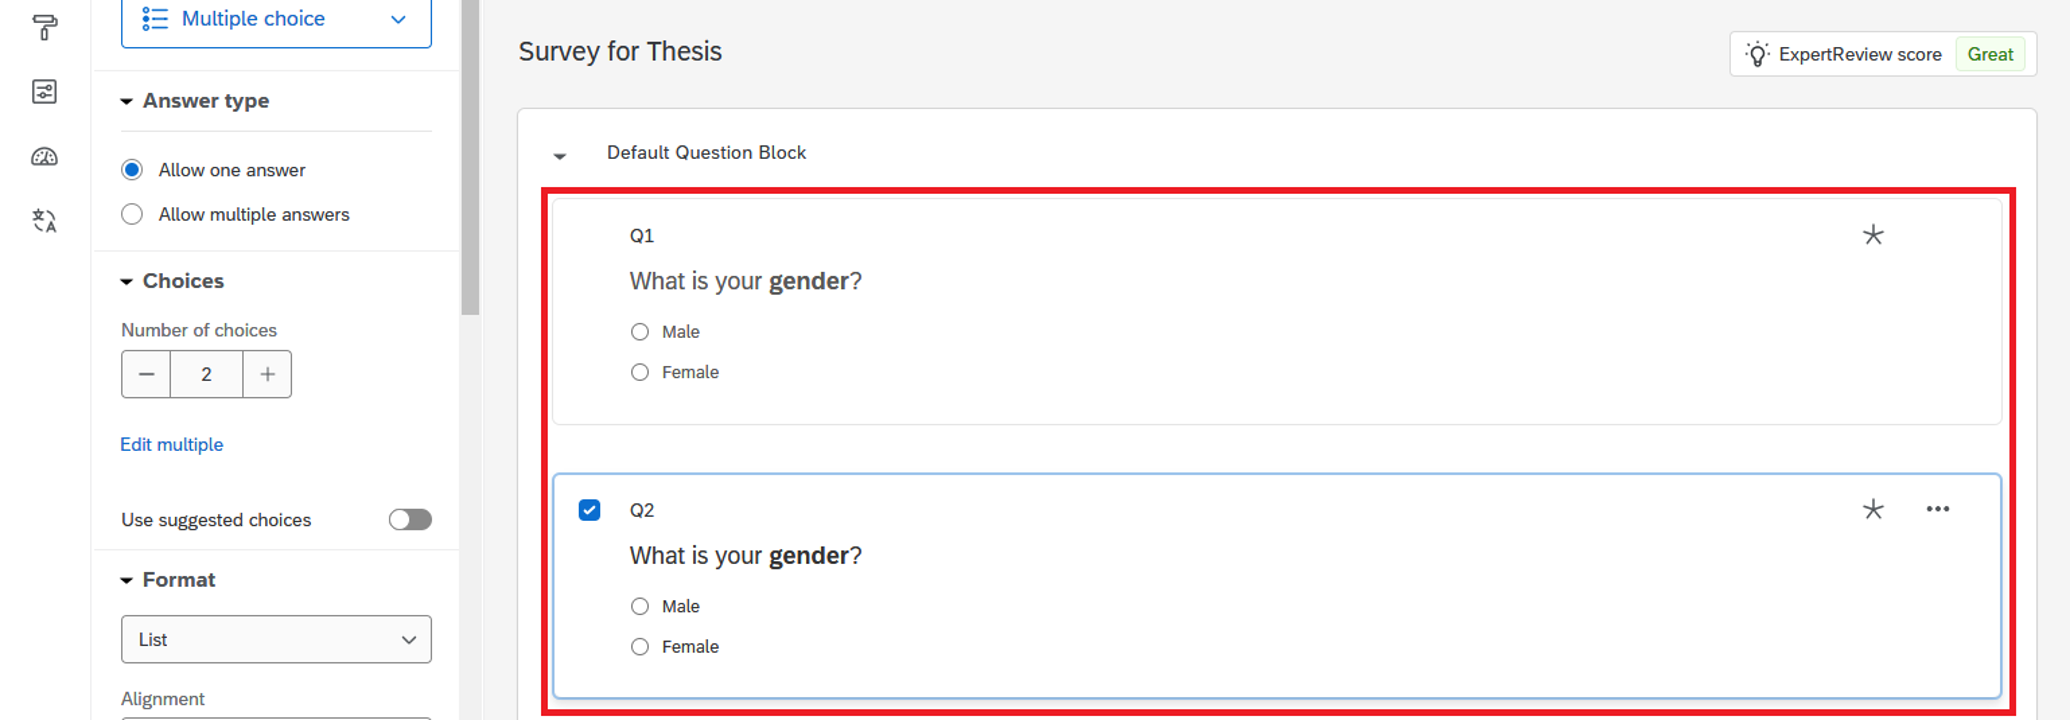
Copying a Question from the Current Survey
1. Click the “…” button and select Copy.
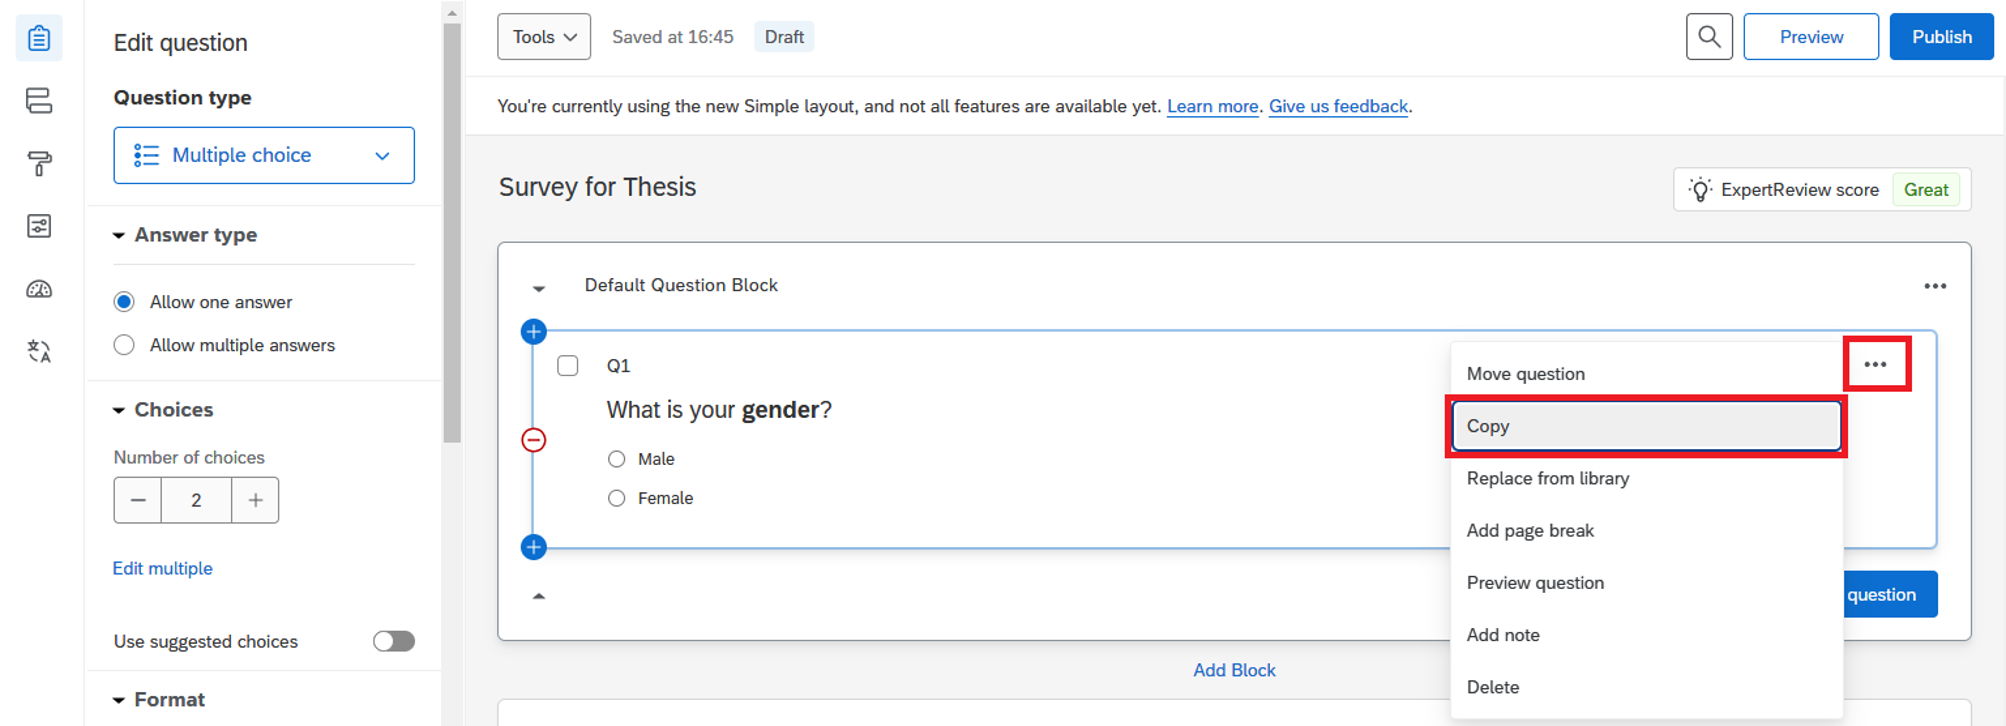
2. The question will be duplicated and placed below the original question.
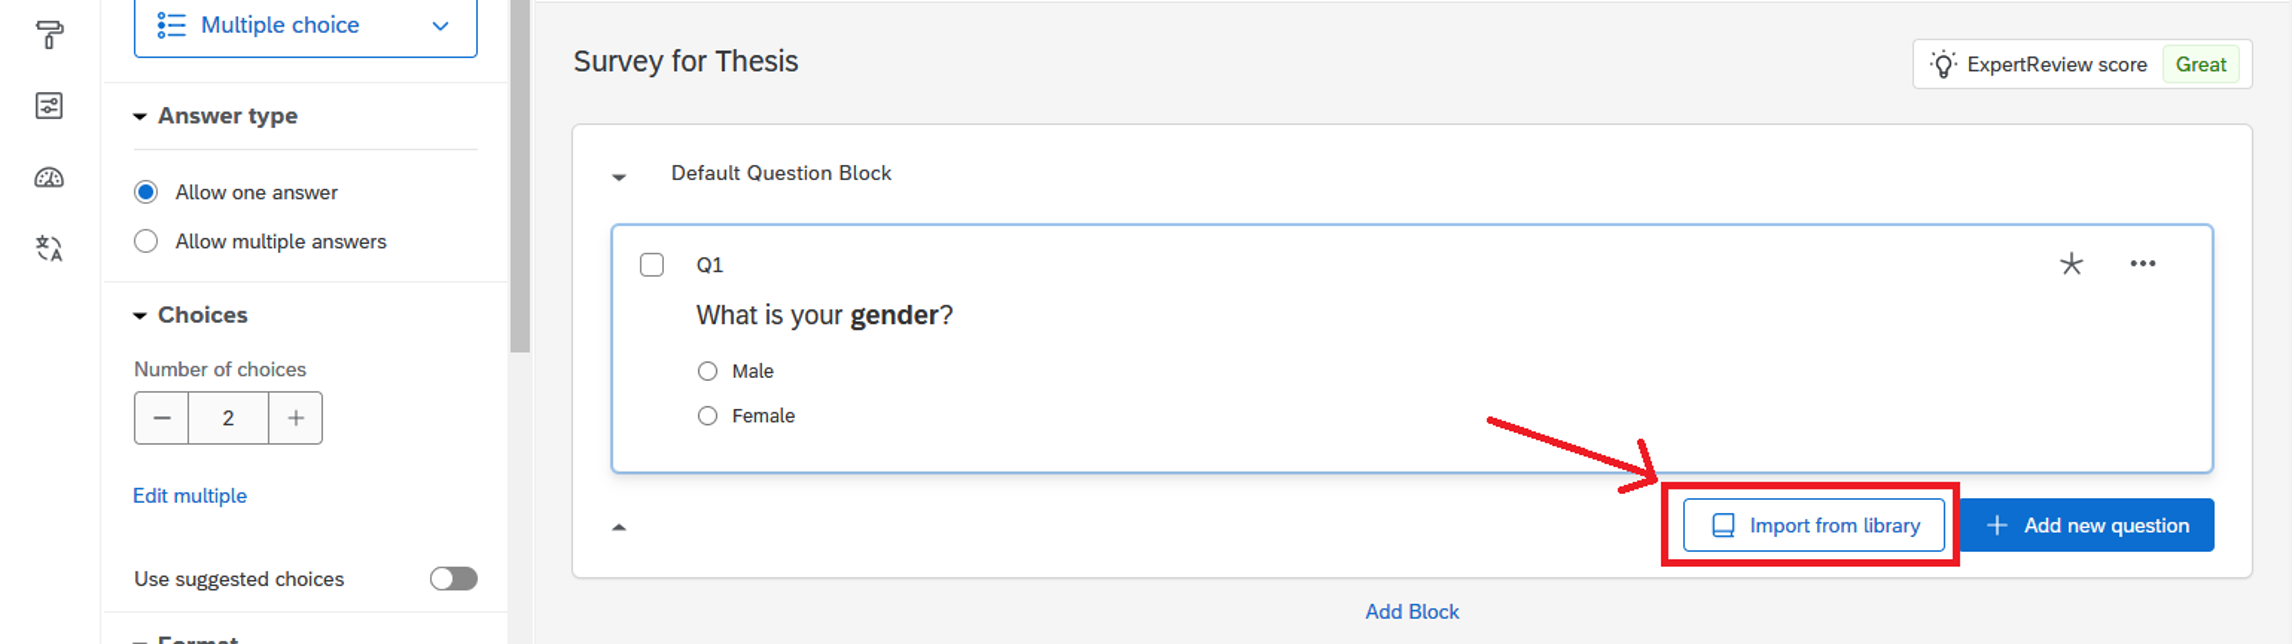
Importing a Question from Another Survey or Library
1. Click the “Import from library” button at the bottom of the question block.
2. The Question Library dialog will appear on the right menu. Select Copy from Existing Survey.
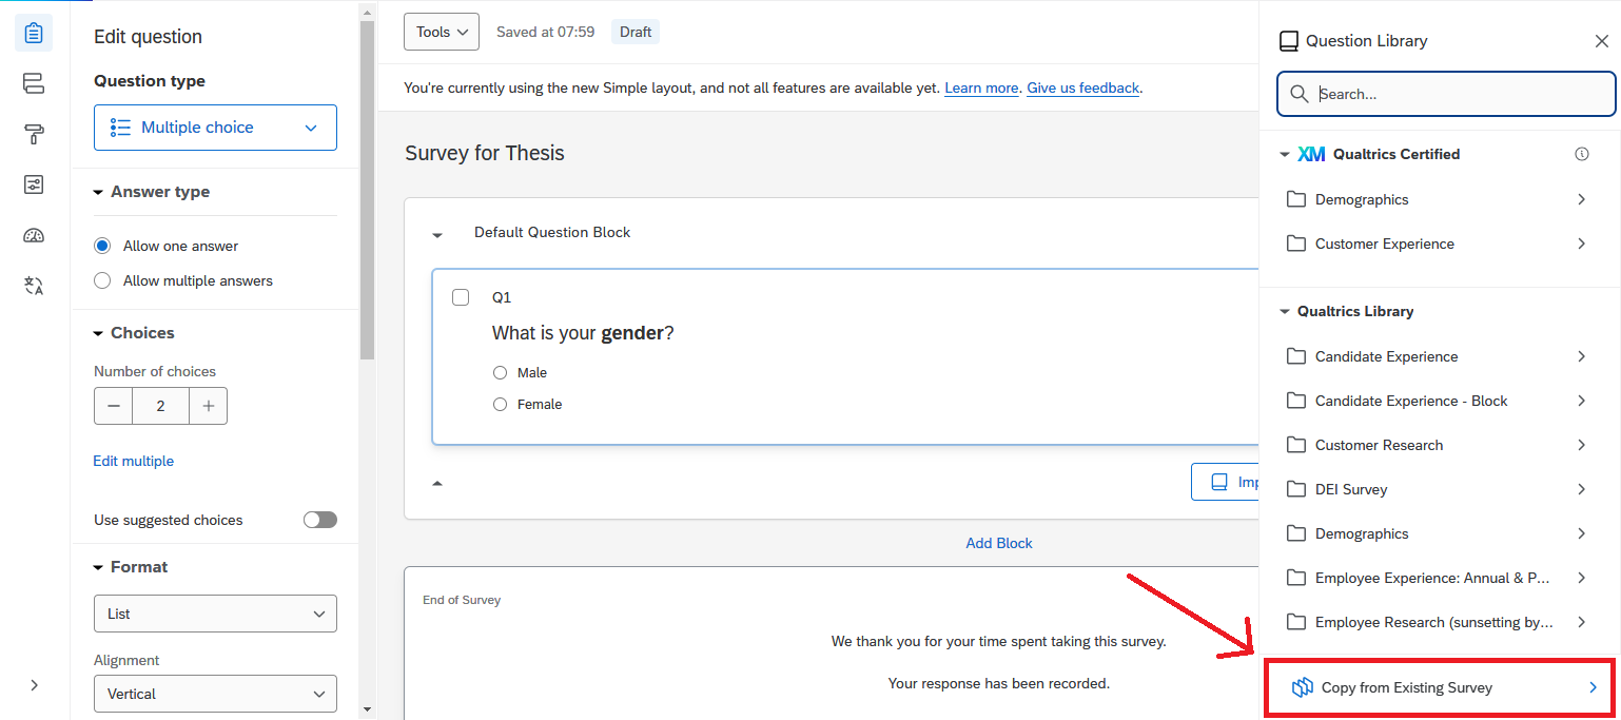
3. Select the desired survey.
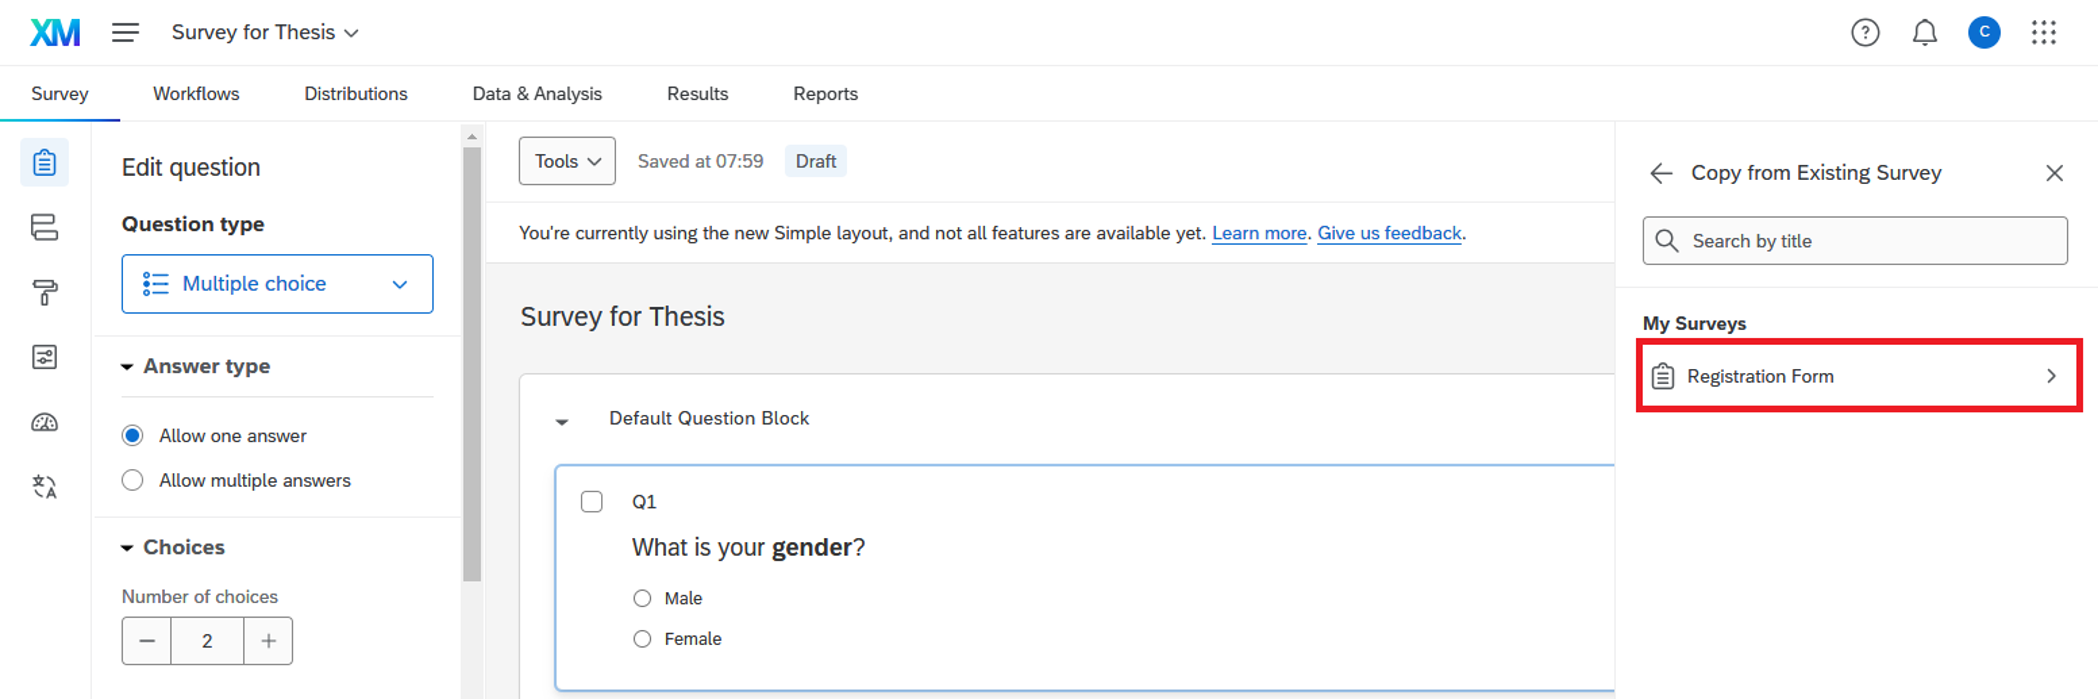
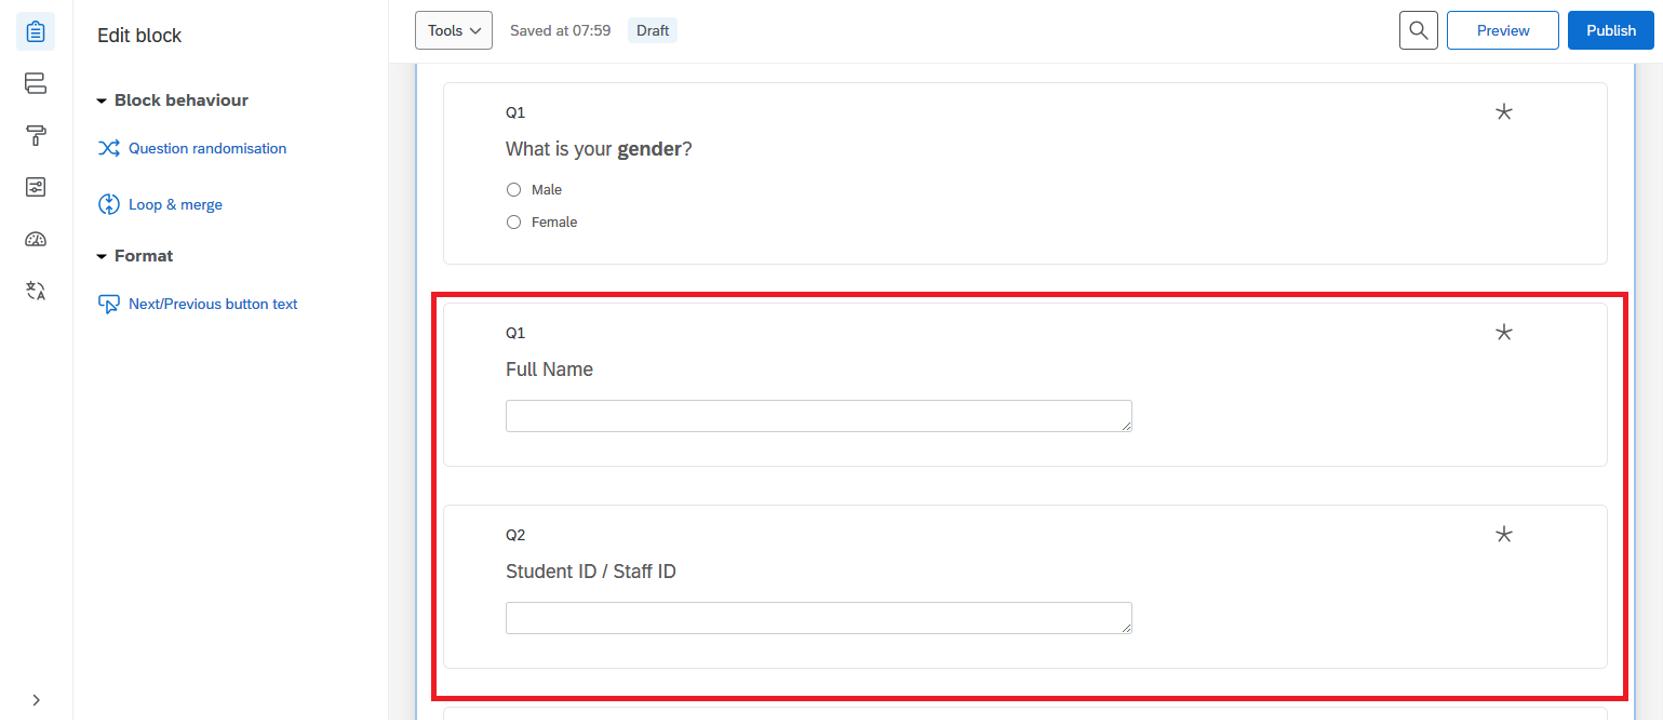
4. Choose the question(s) you wish to import and click the “Import question” button.
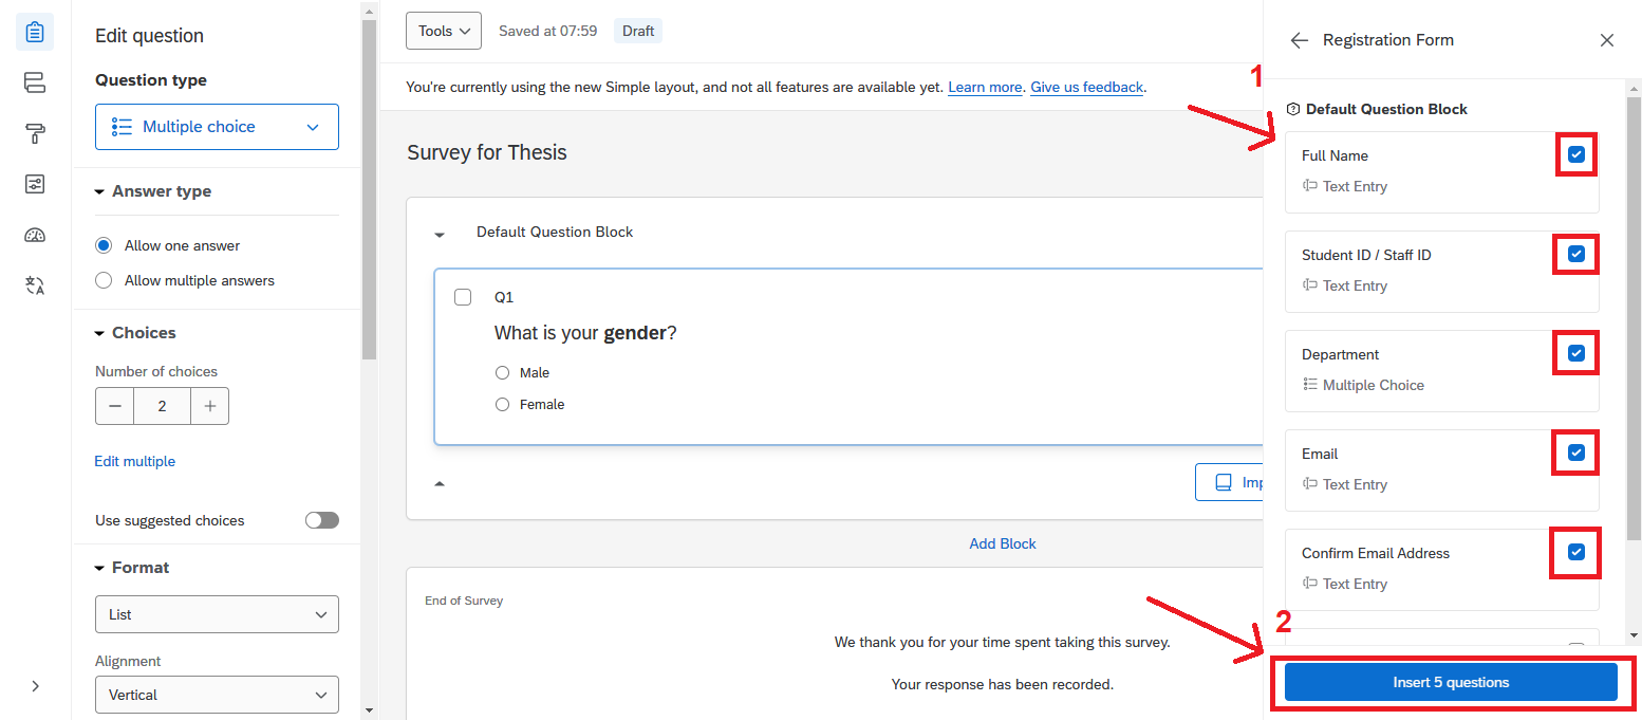
5. A copy of the selected question(s) will be added to your survey as the last question(s).
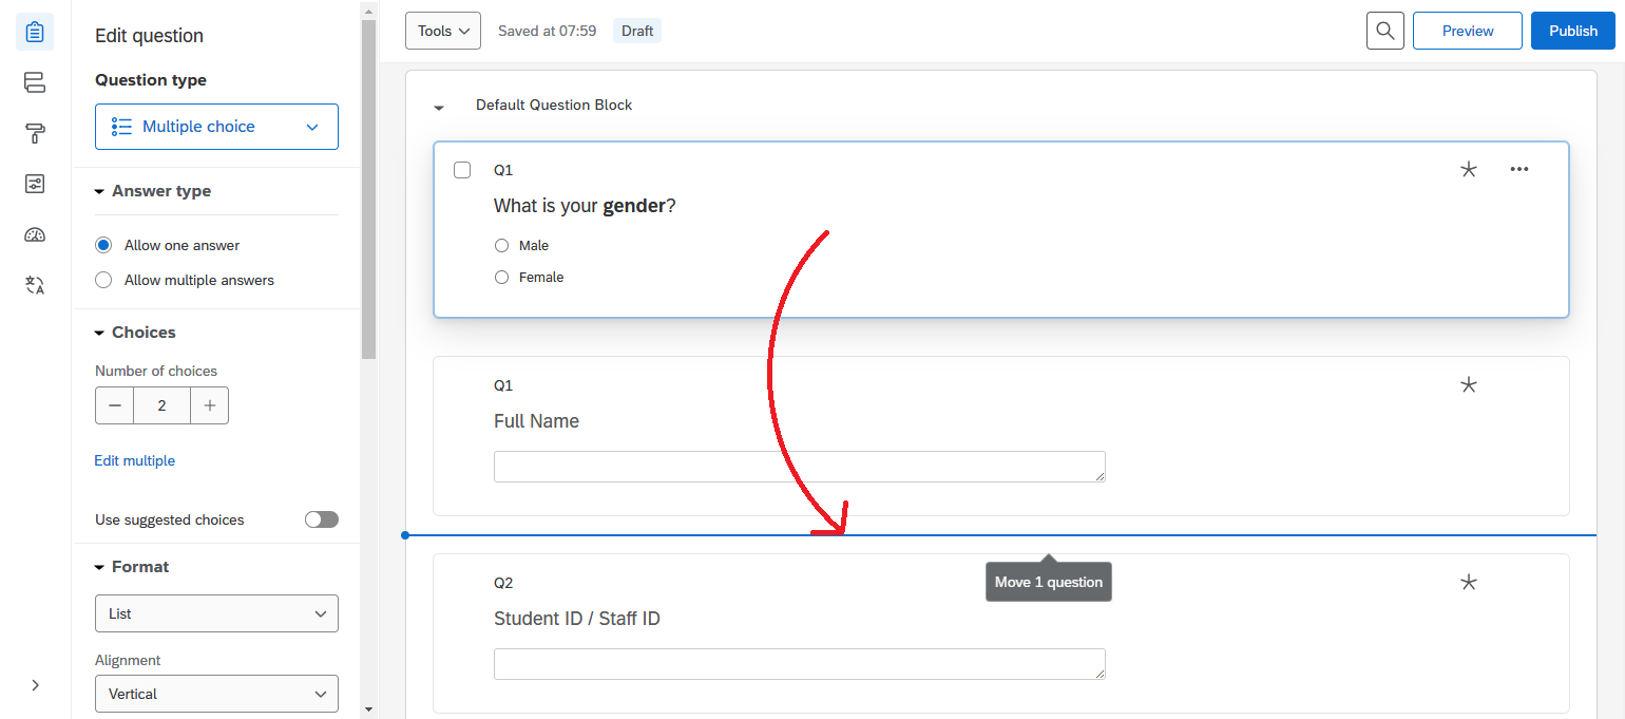
“Drag and Drop” Method to Move a Question
You can simply hover your mouse over the question, then drag and drop it to the desired position.
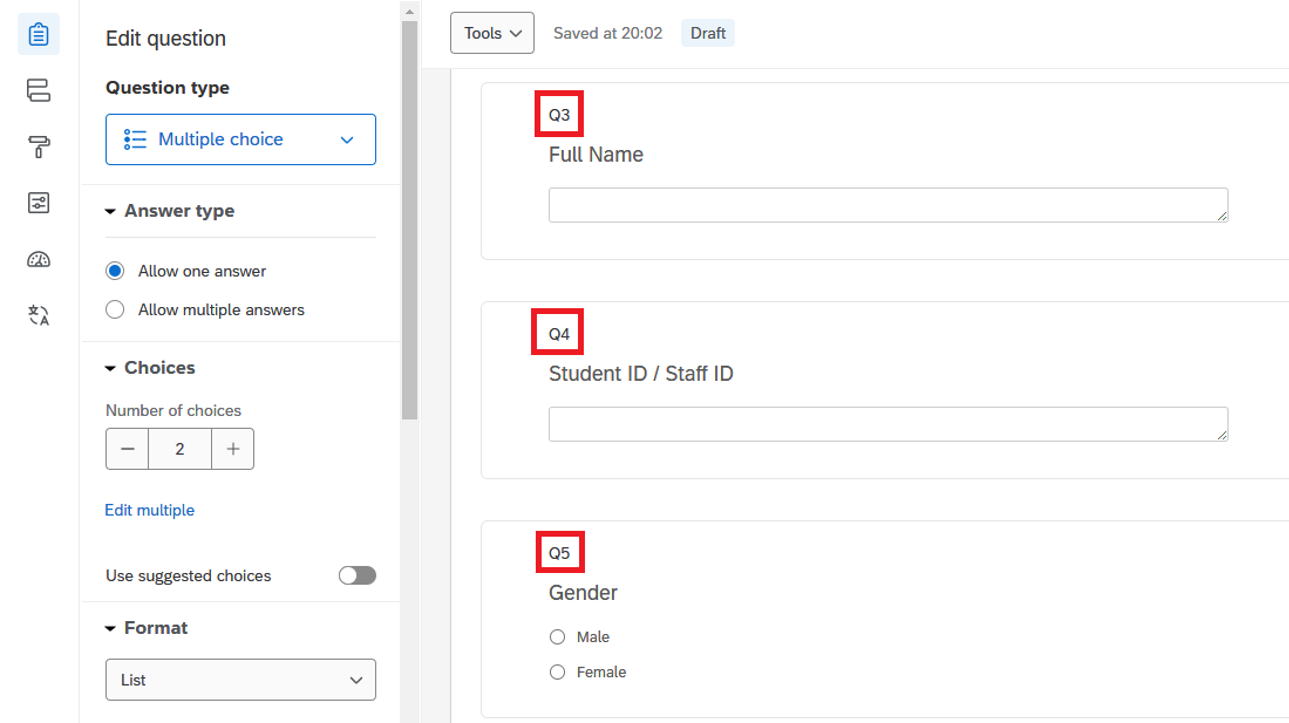
Moving a Question Using the Options Menu
1. Click the “…” button and select “Move question”.
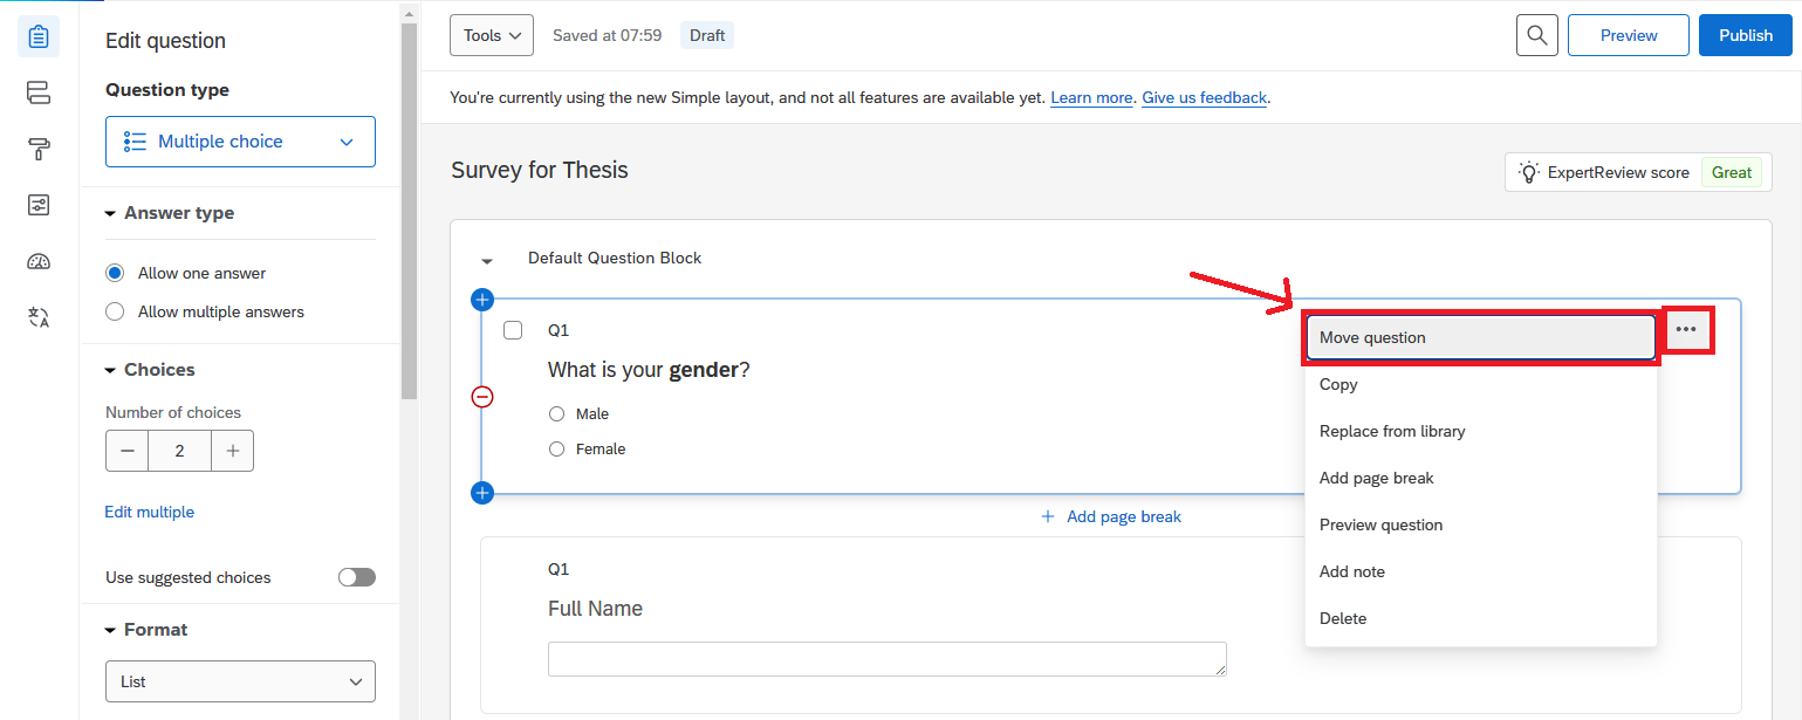
2. The “Move question to” dialog will appear. Click the Position dropdown to select the destination for the question. Selecting Top of block or Bottom of block requires no further criteria.
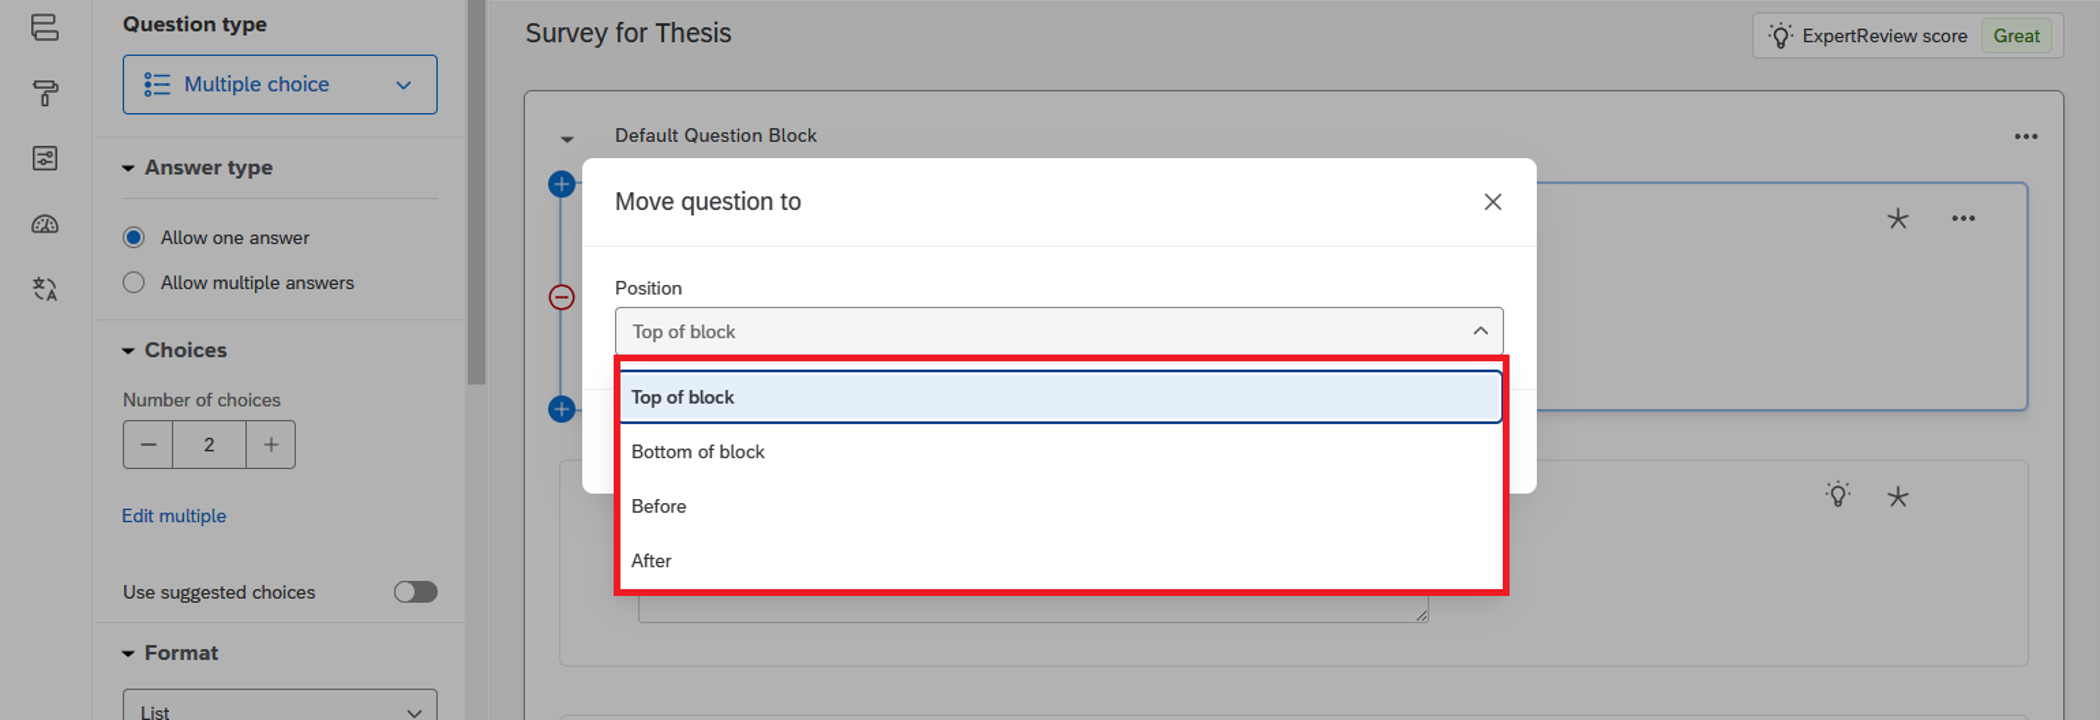
3. If you select Before or After, you will need to specify which question the moving question should be placed before or after. Then, click the “Confirm” button to proceed.
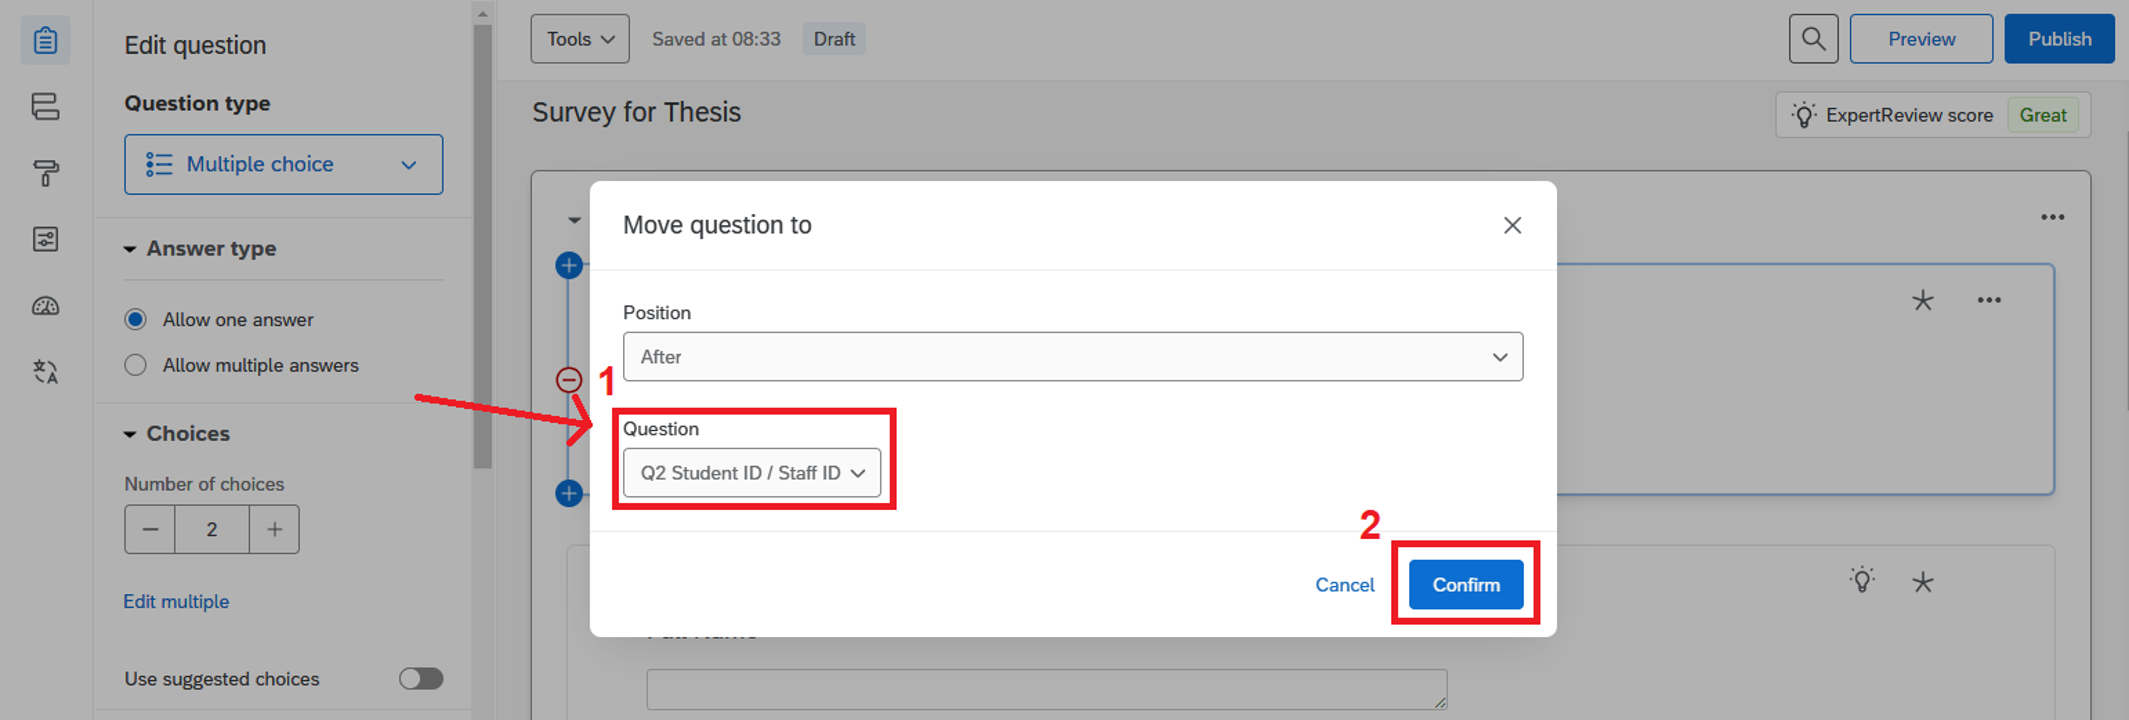
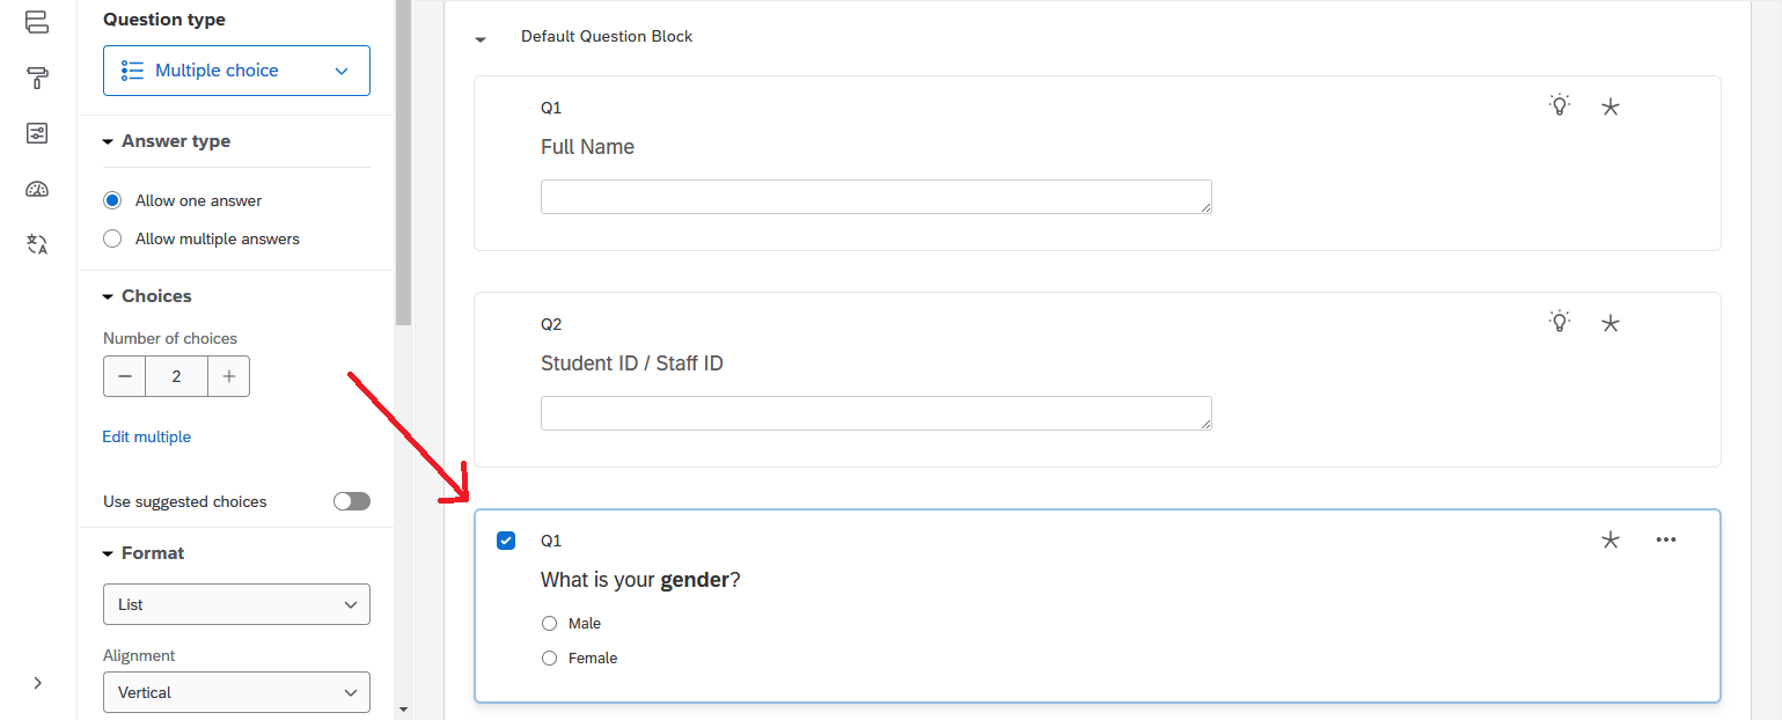
4. The question will now be moved to the specified position (e.g., the gender question is placed after the “Student ID / Staff ID” question).
Adjusting the Number of Questions
1. Click the “Tools” dropdown and select “Auto-number questions”.
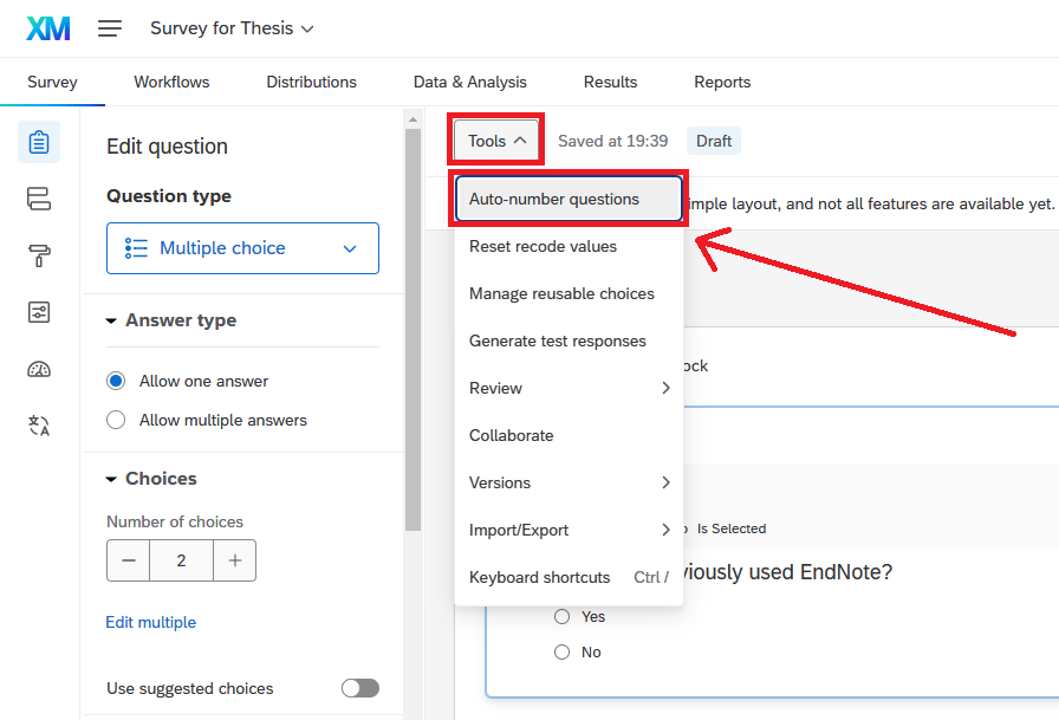
2. In the Auto-Number Questions dialog, select the desired numbering format for your survey (e.g., Sequential Numbering), then click “Apply”.
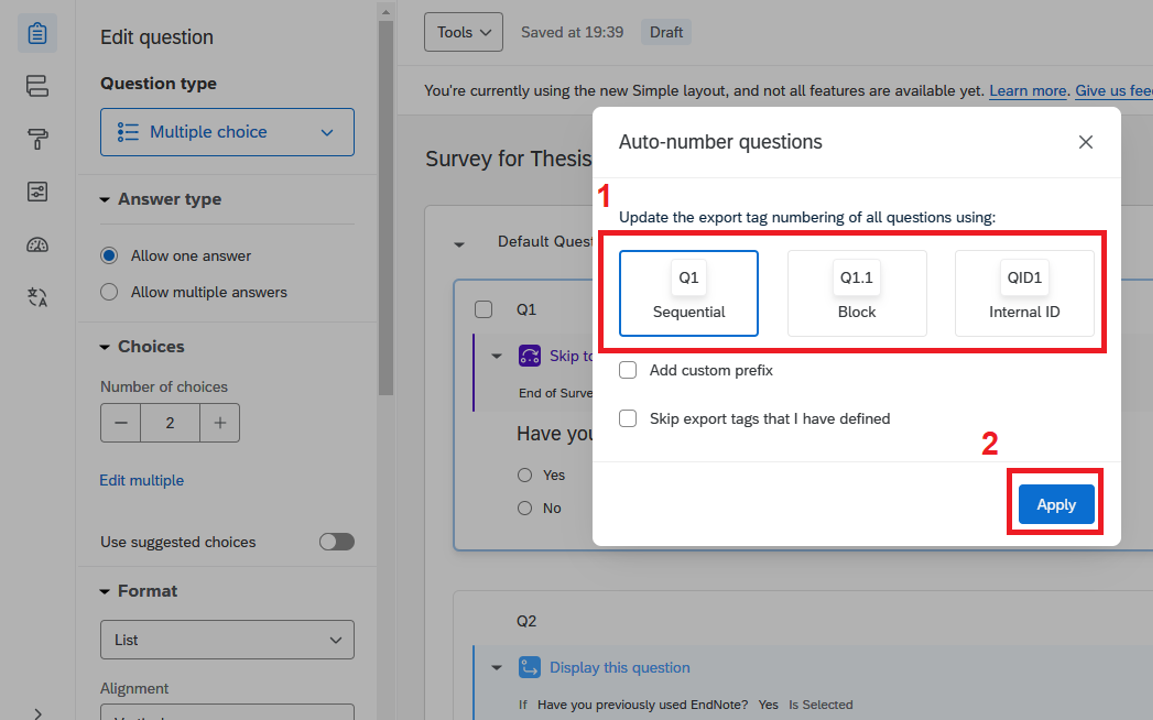
3. The question numbers in your survey will be re-ordered accordingly.
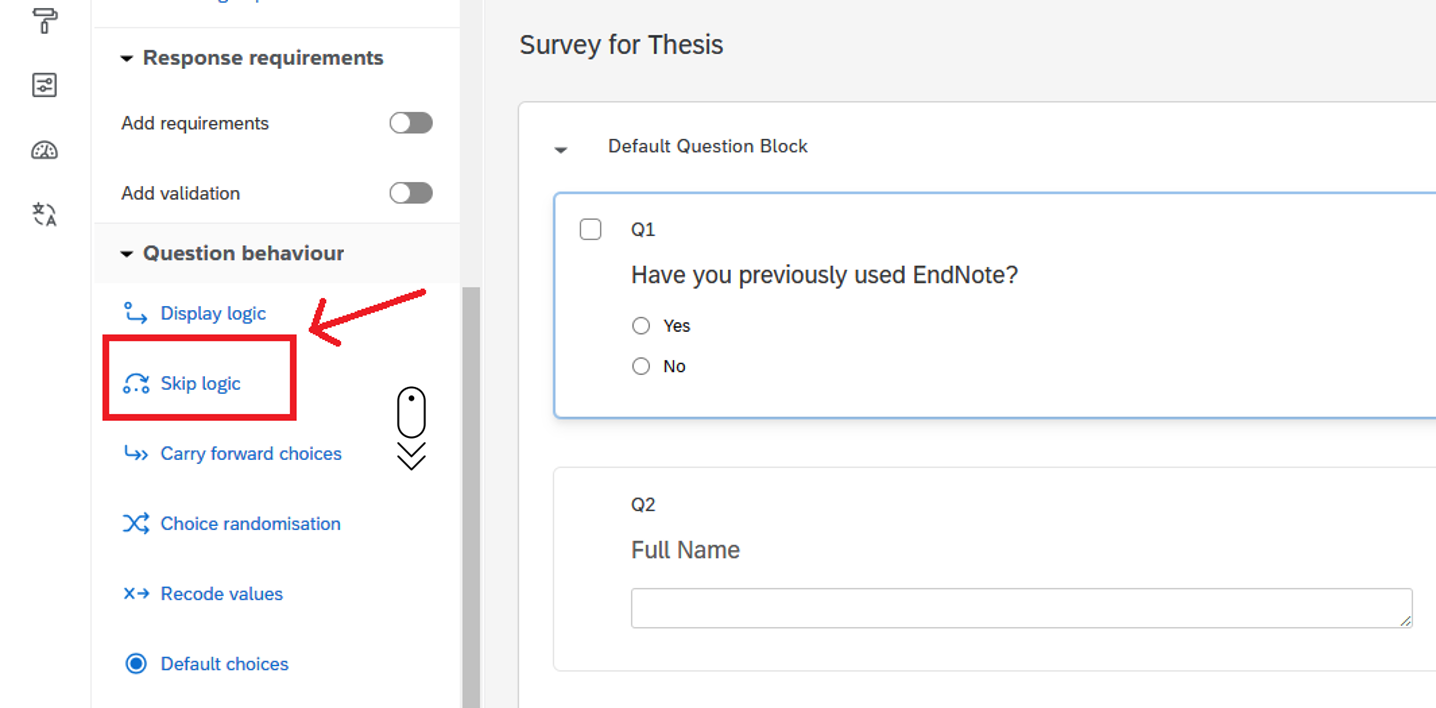
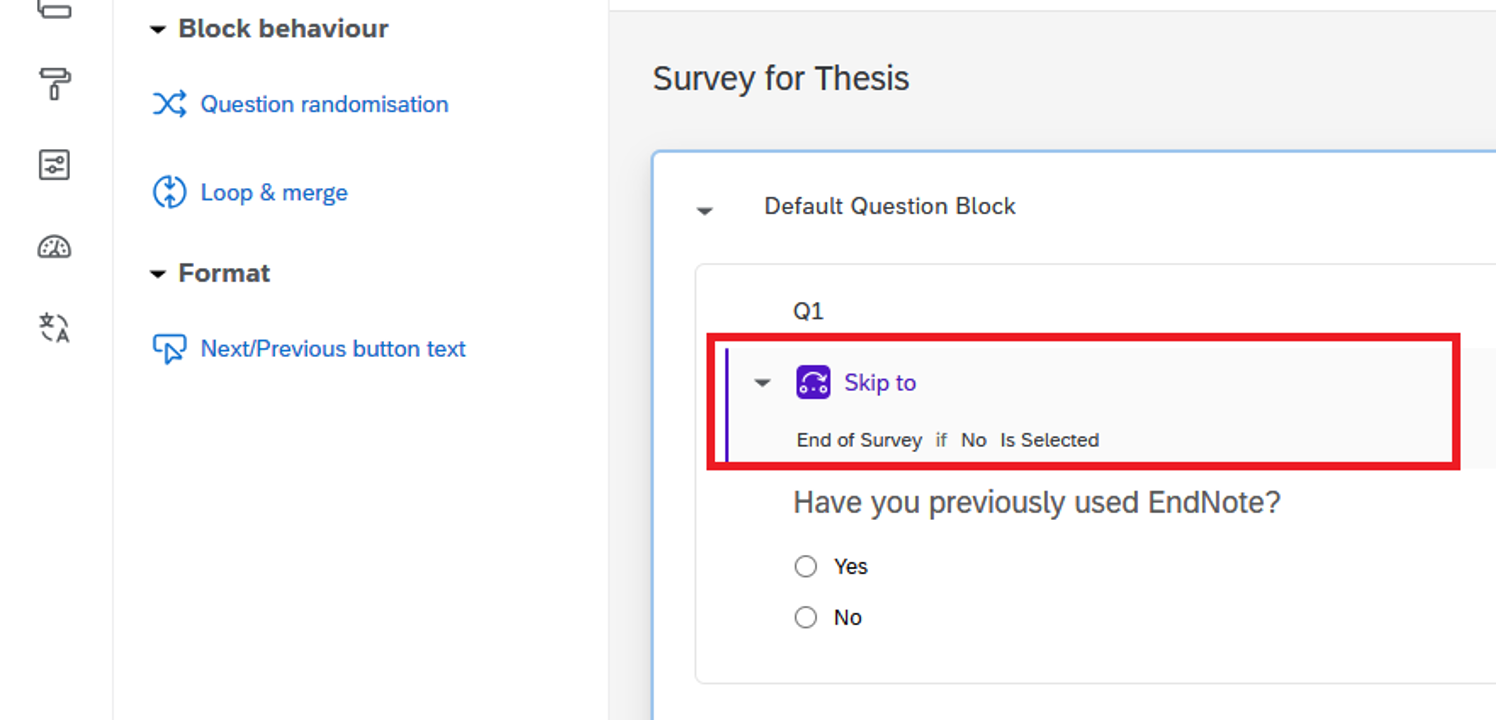
Adding a “Skip Logic”
1. Select the question, scroll to the bottom of the Edit Question pane, and click “Skip logic”.
2. Apply the rule by selecting the required criteria in the “Skip logic” dialog, then click “Confirm”.
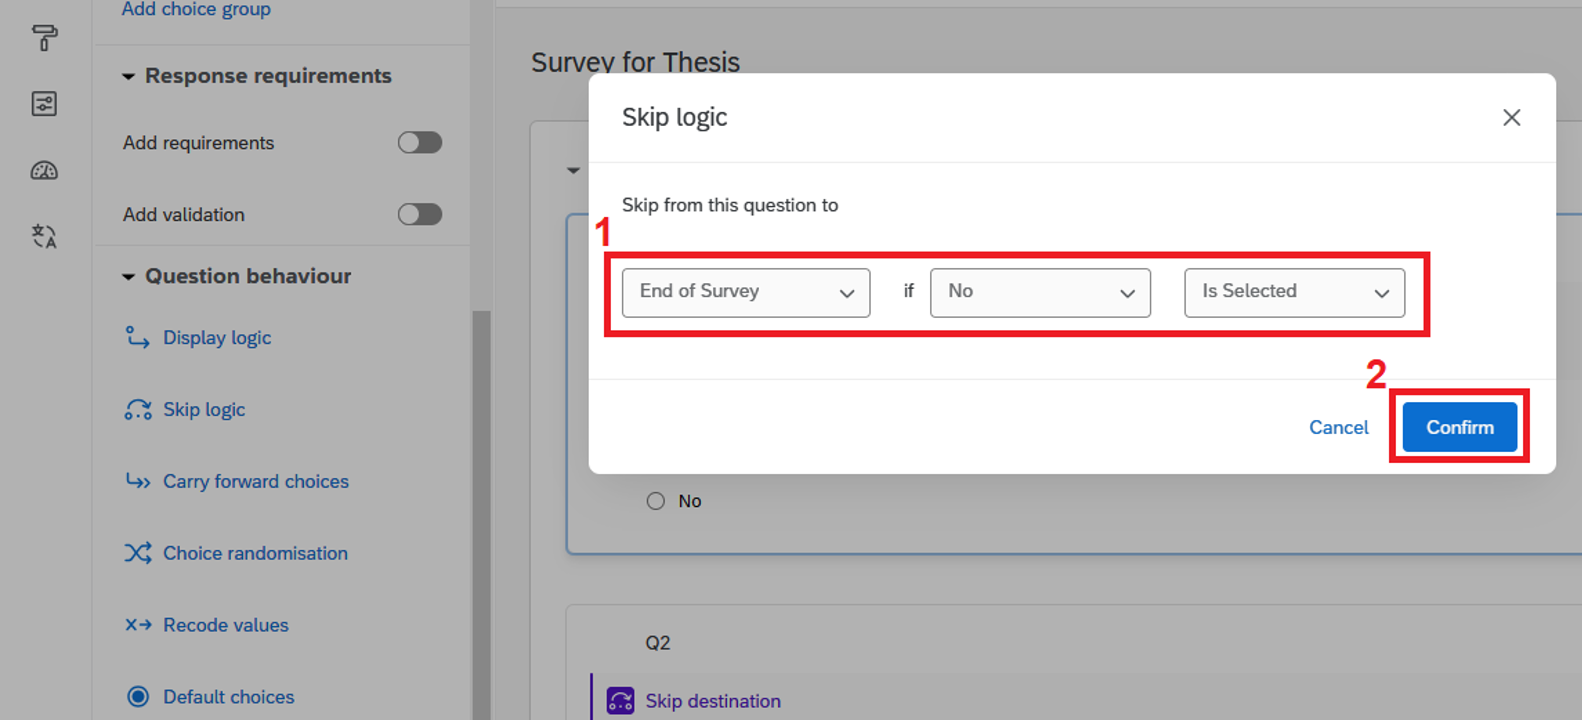
3. The details of the skip logic will be displayed.
Adding a “Display Logic”
1. Select the question, scroll to the bottom of the Edit Question pane, and click “Display logic”.
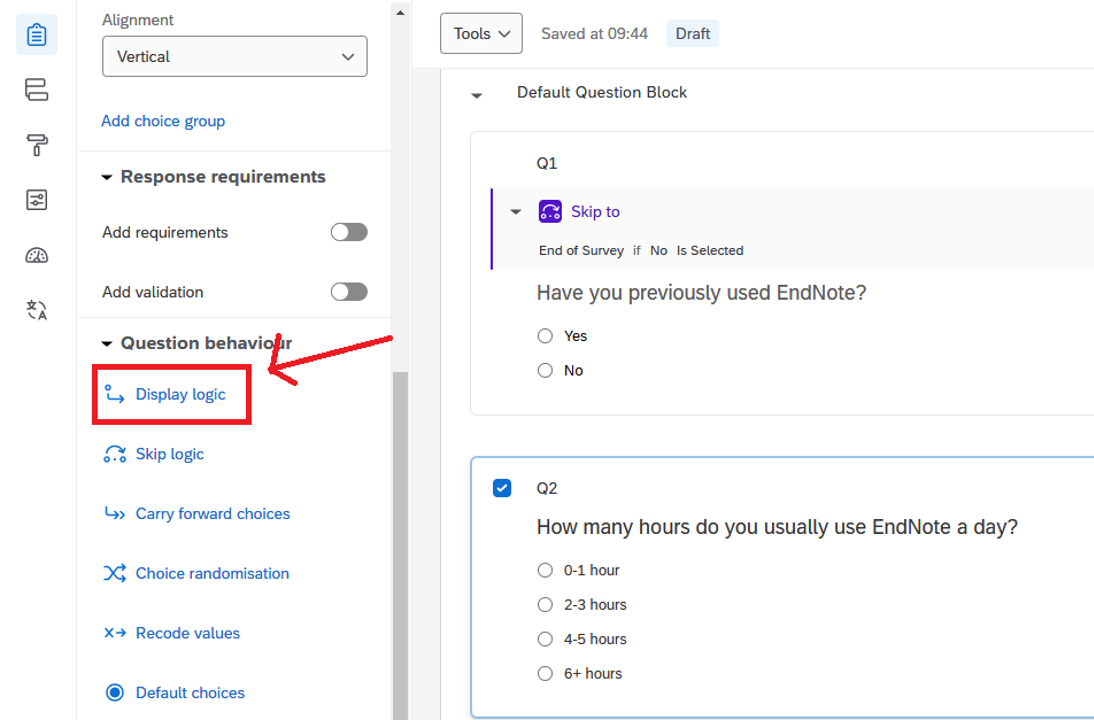
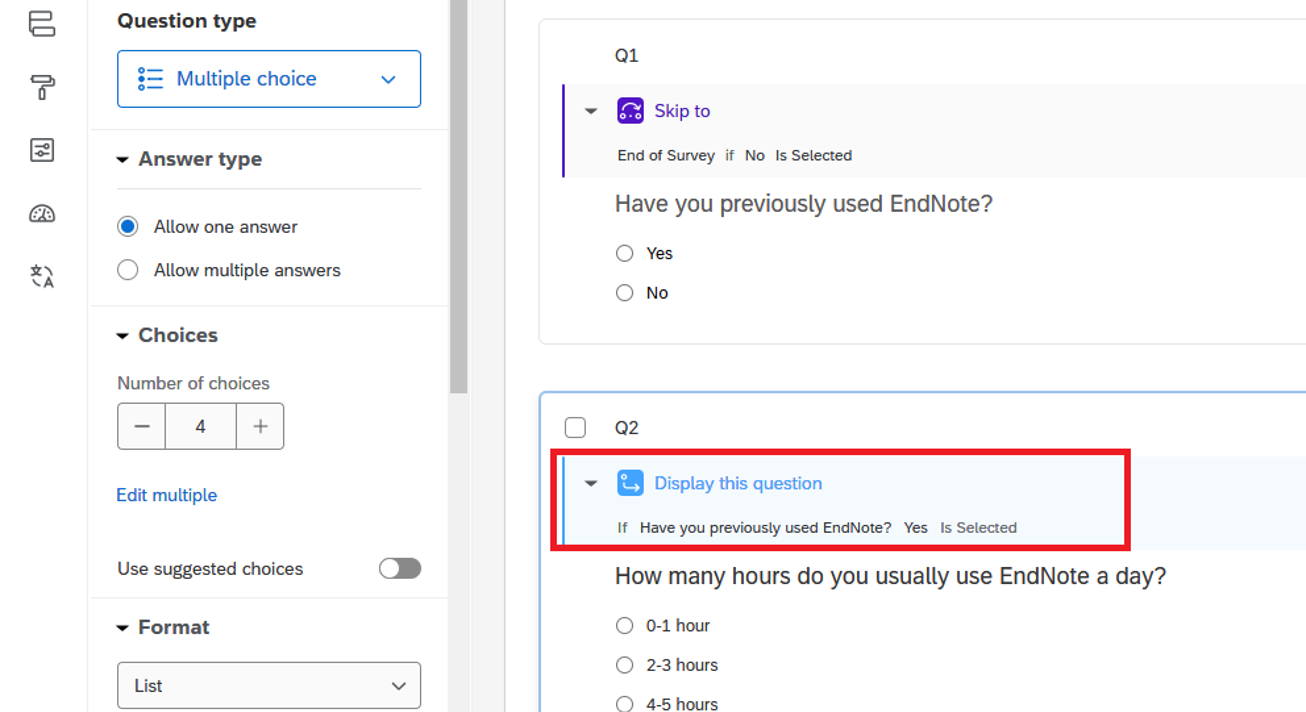
2. Apply the rule by selecting the required criteria in the “Display Logic” dialog, then click “Confirm”.
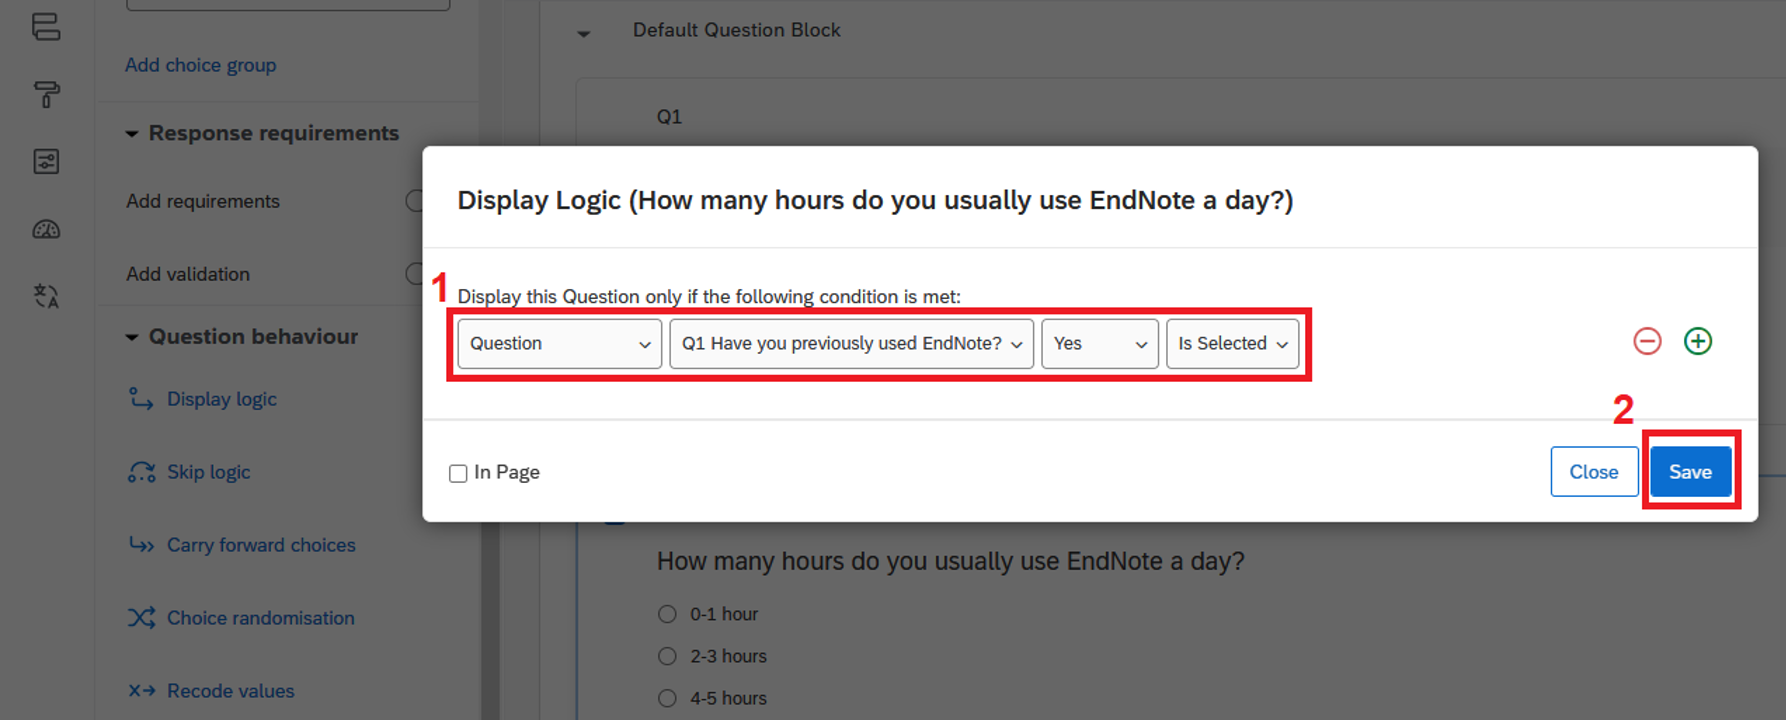
3. The details of the display logic will be displayed.
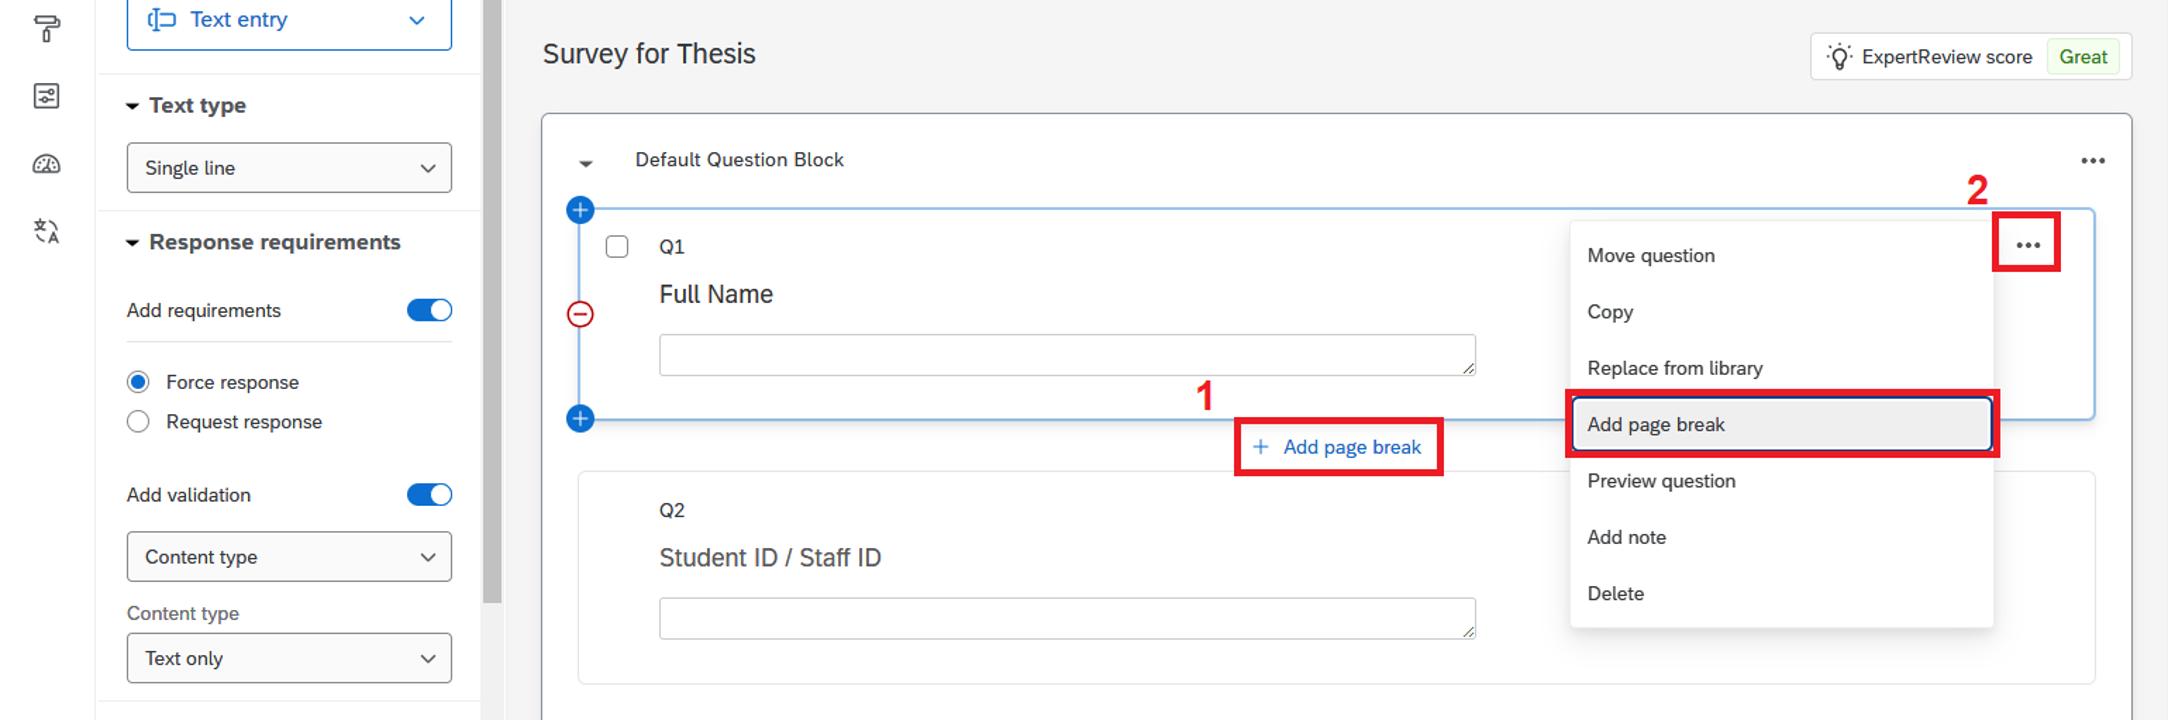
Adding a Page Break
1. Click “+ Add page break” between the questions.
2. Alternatively, click the “…” button and select “Add page break”. A page break will be added.
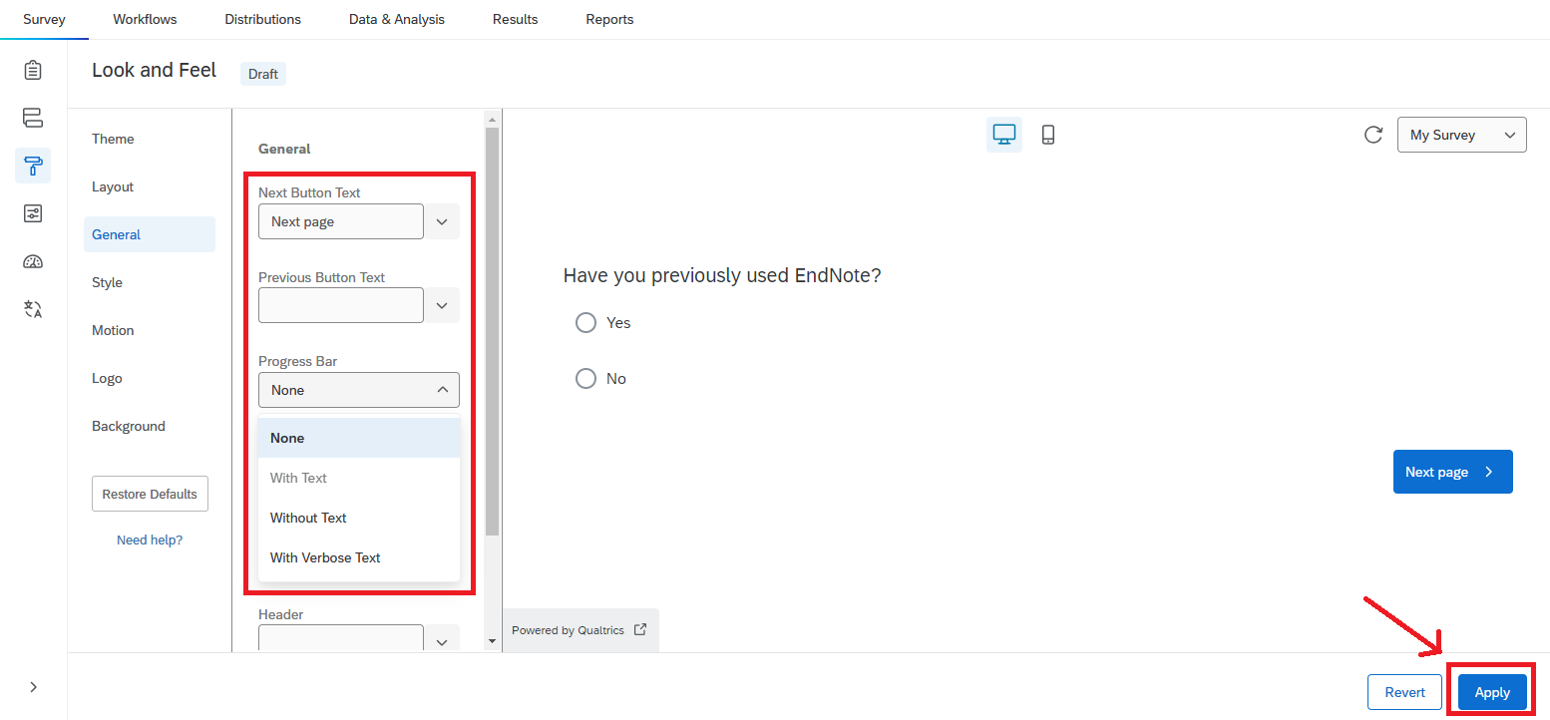
Showing Progress Bar & Changing Button Text
1. Click the third button on the left side (“Look and Feel” button), then select “General”.
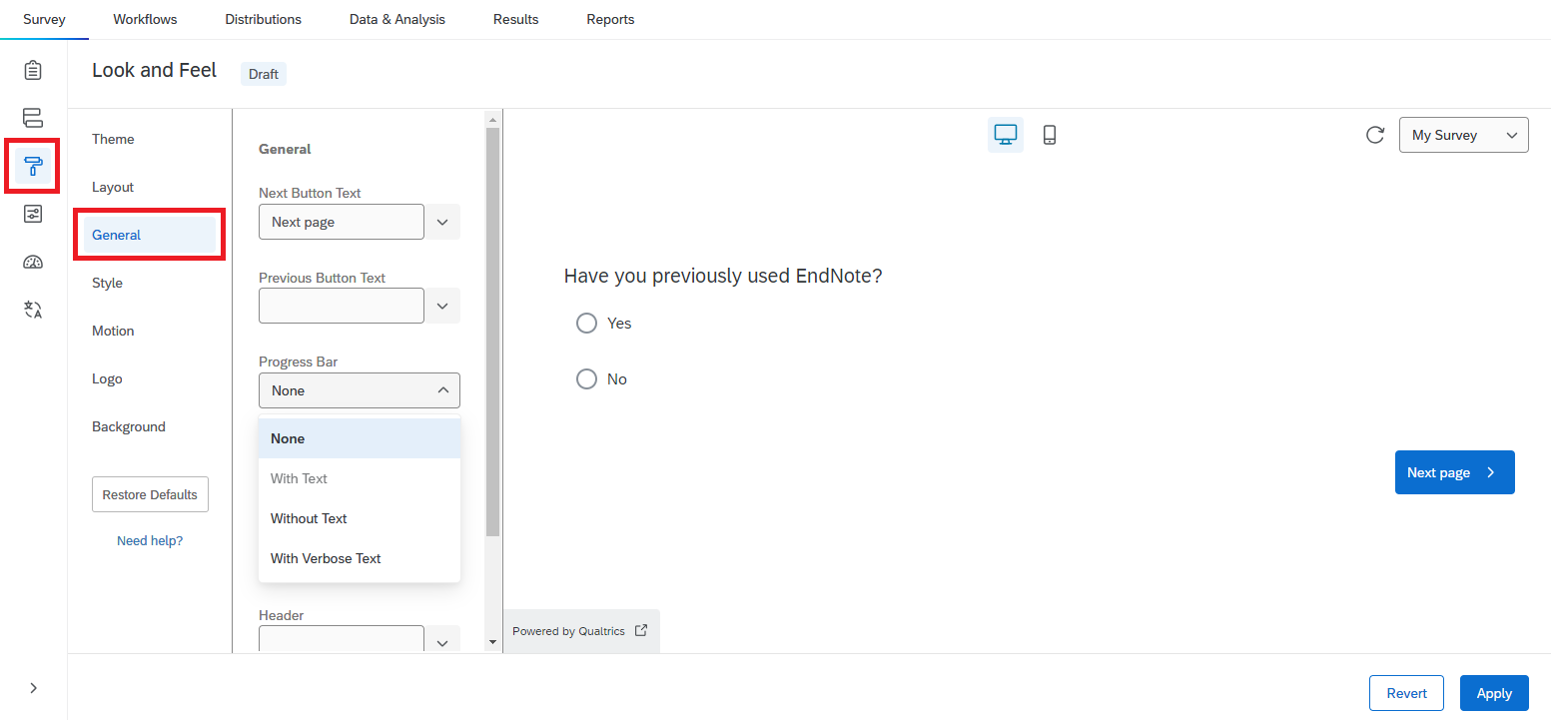
2. Click the “Progress Bar” dropdown and select the desired progress bar format.
3. You may also change the “Next Button Text” and “Previous Button Text” as needed.
4. Click “Apply” to confirm your changes.
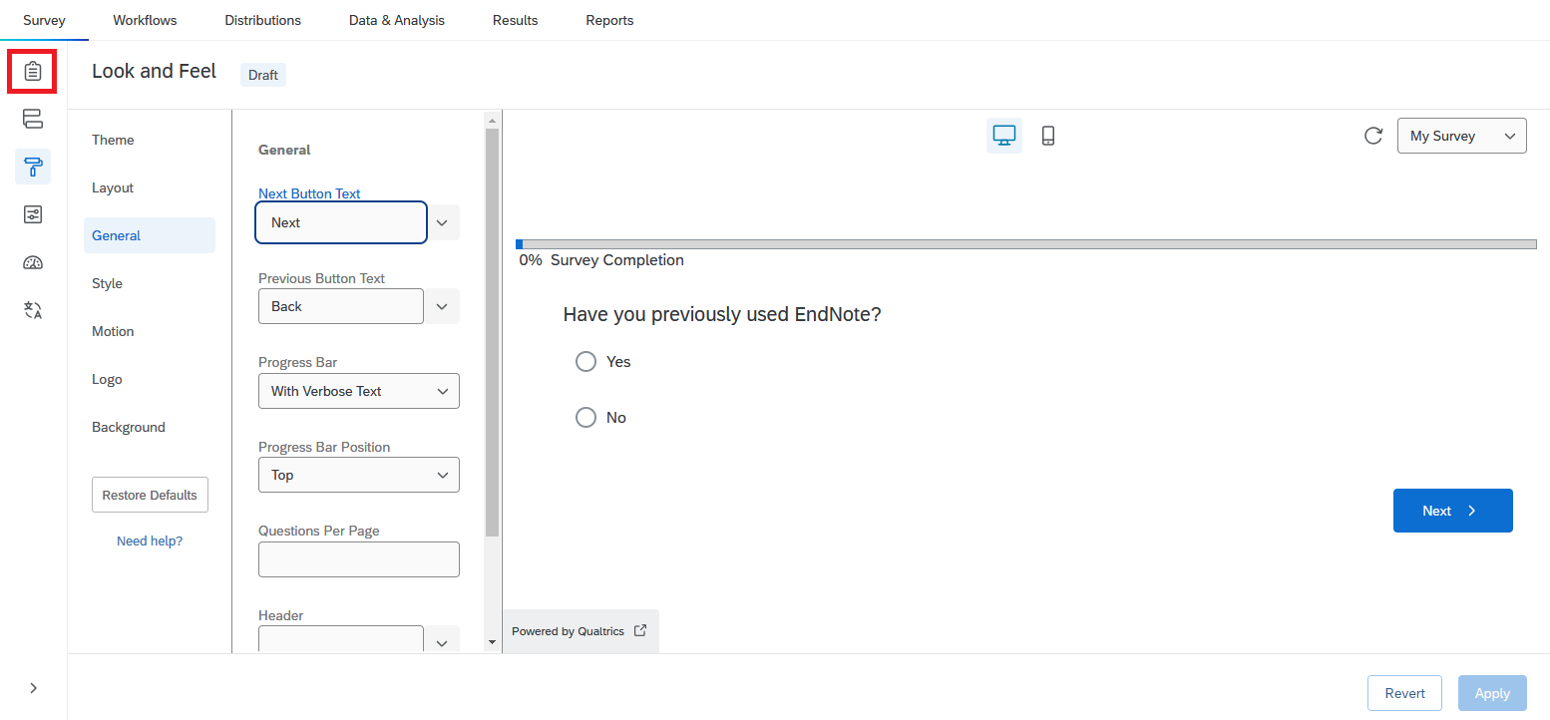
5. Click the first button on the left side (“Builder” button) to return to the Survey page.
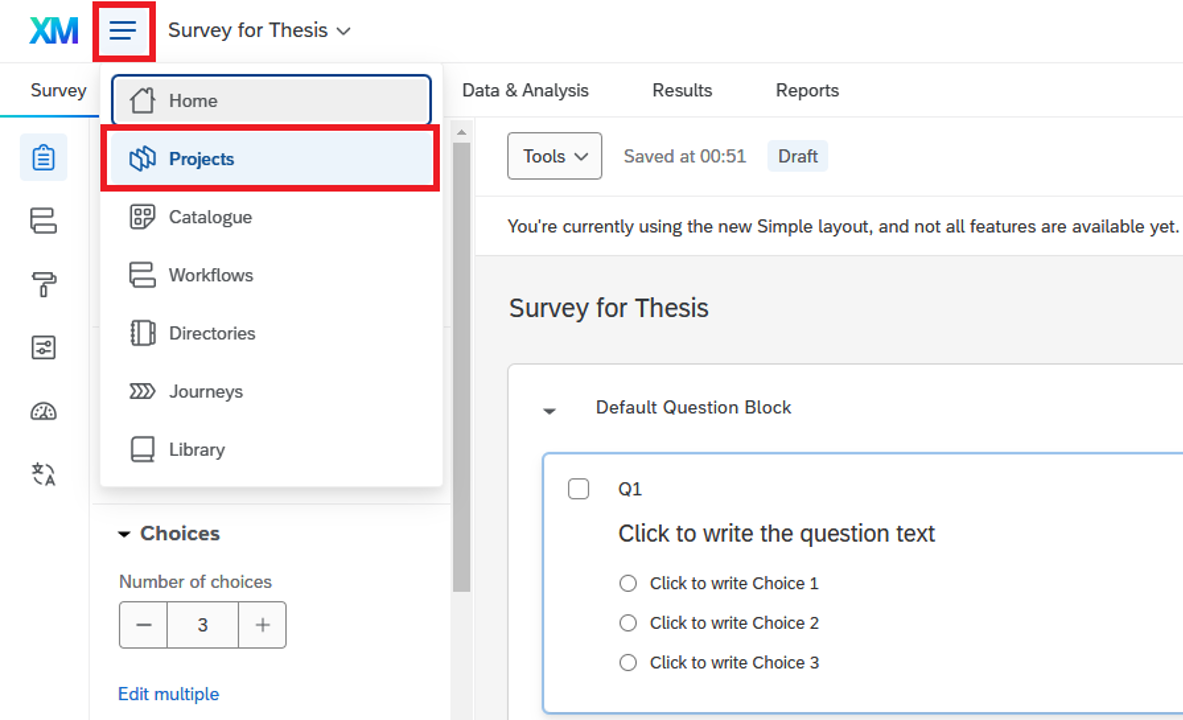
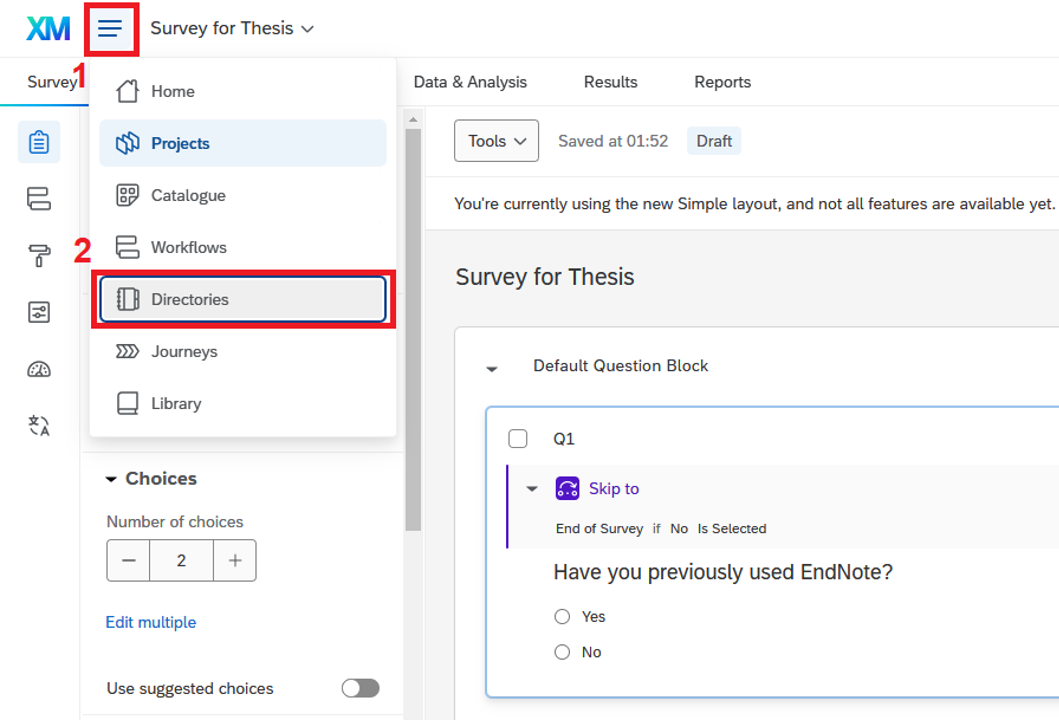
Creating an Email Contact List of your Target Respondents
1. Click the “Menu” button and select “Directories".
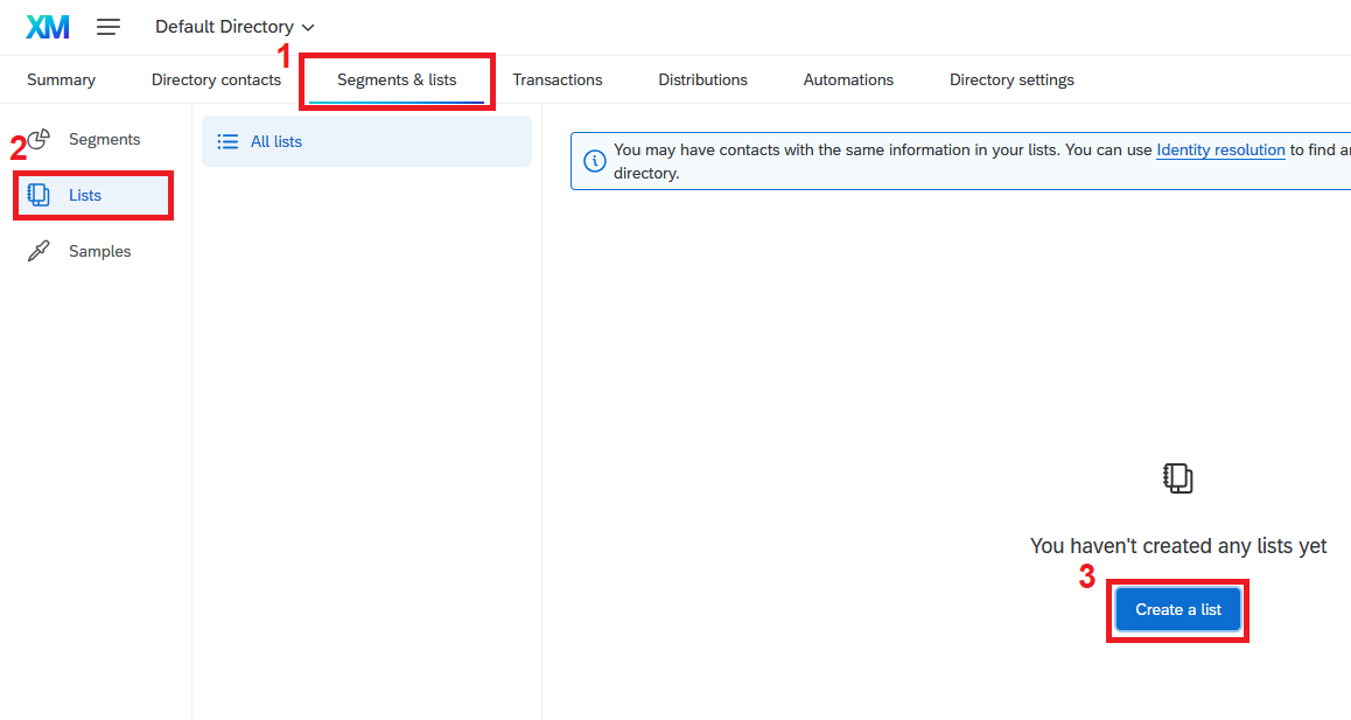
2. Click “Segments & lists”, then select “Lists” and click the “Create a list” button.
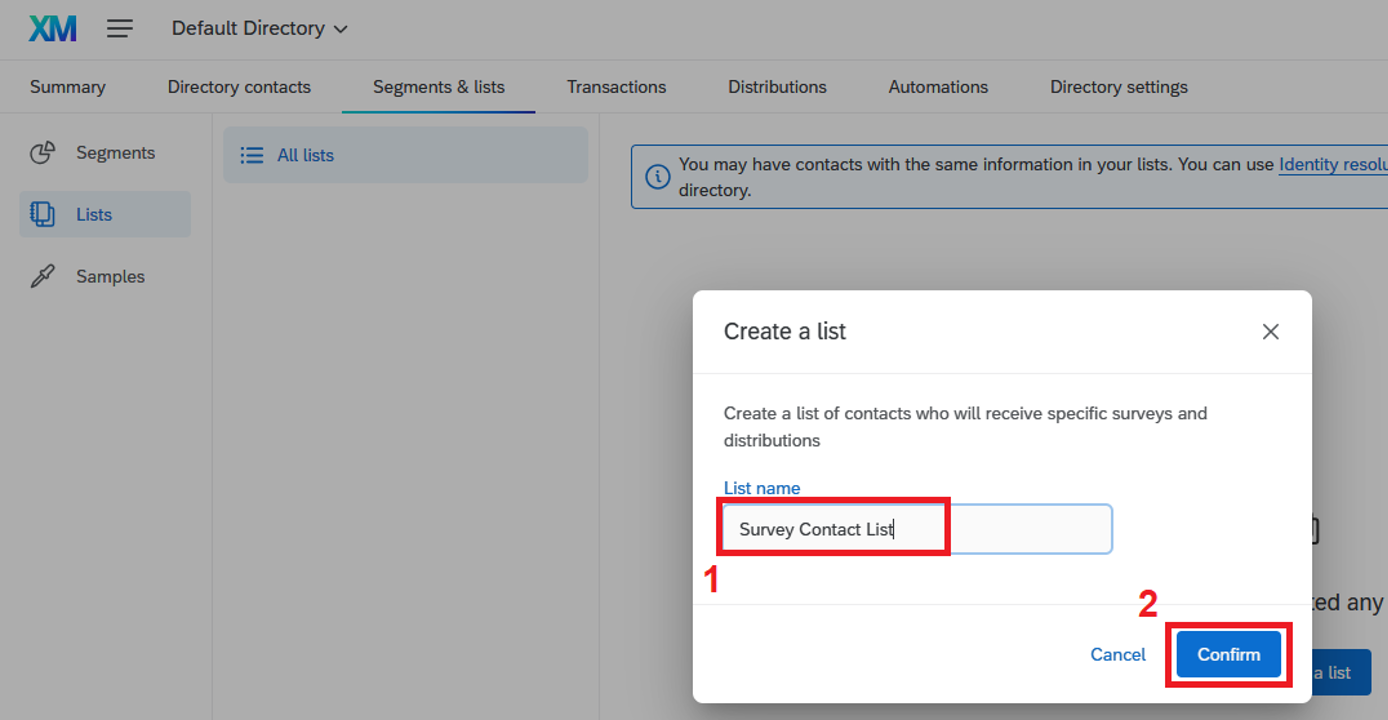
3. Enter your desired list name, then click “Confirm".
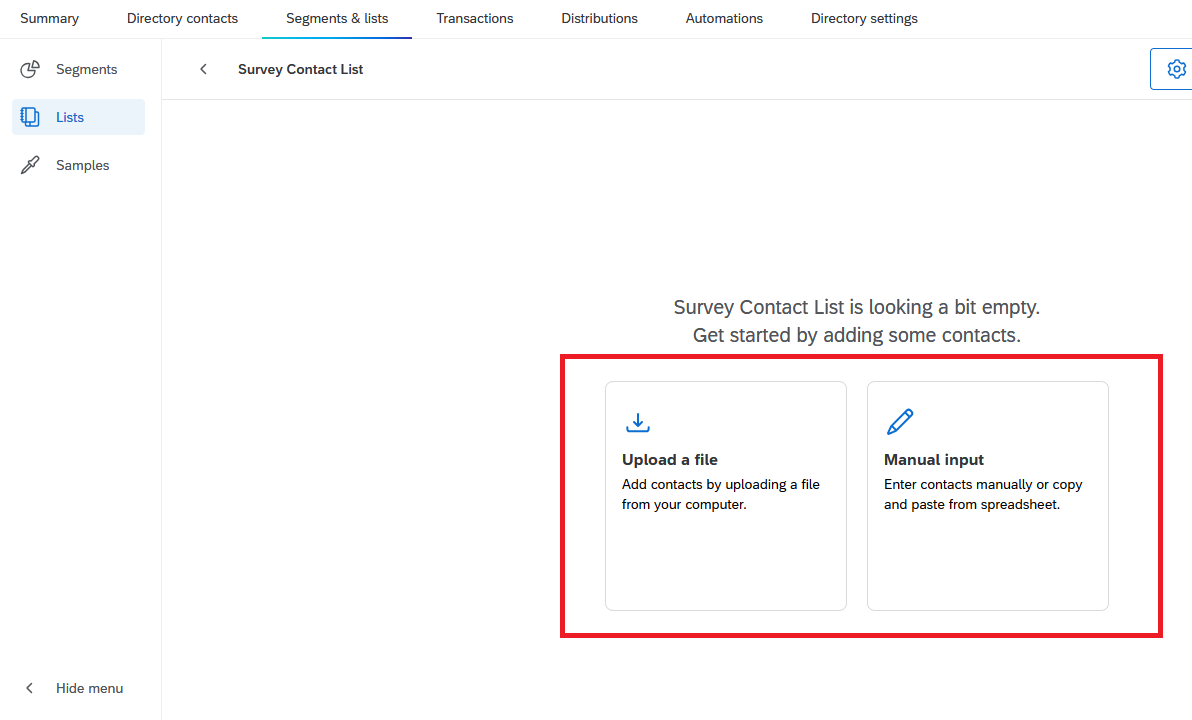
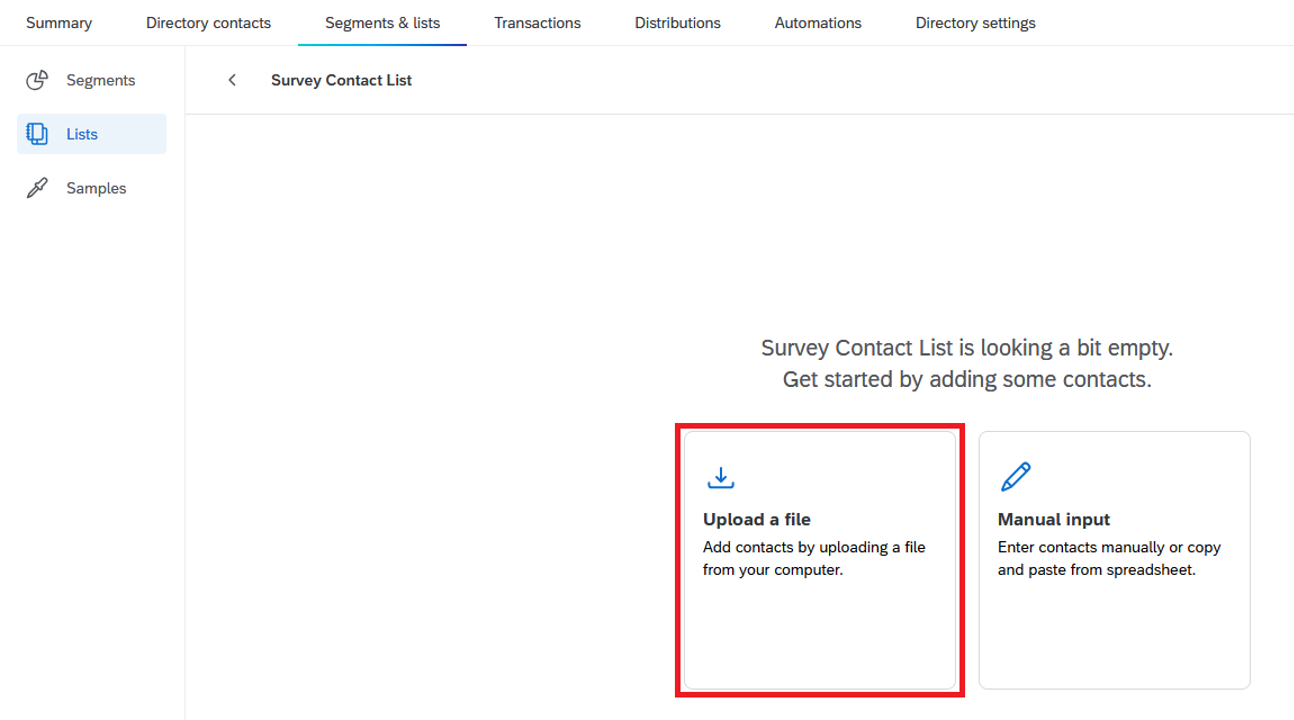
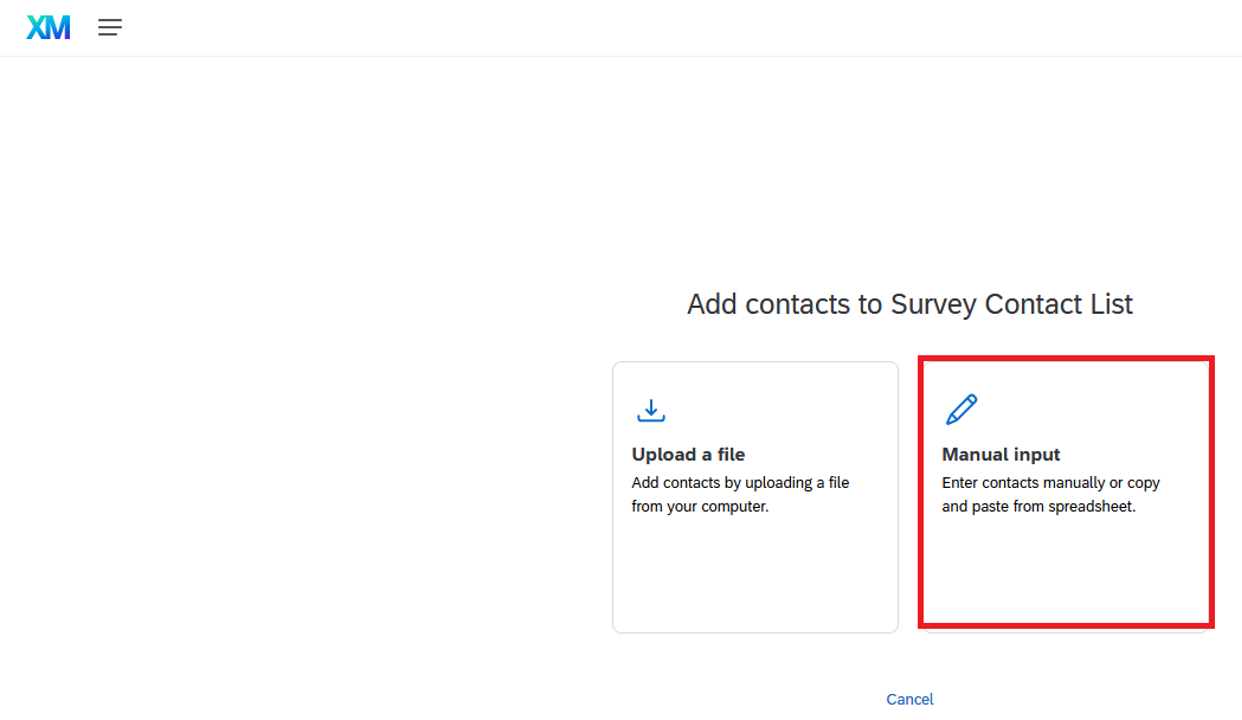
4. You can now add members to the contact list by uploading a file (a .csv file) or by manual input.
Adding Email Contacts by Uploading a File (a .csv file)
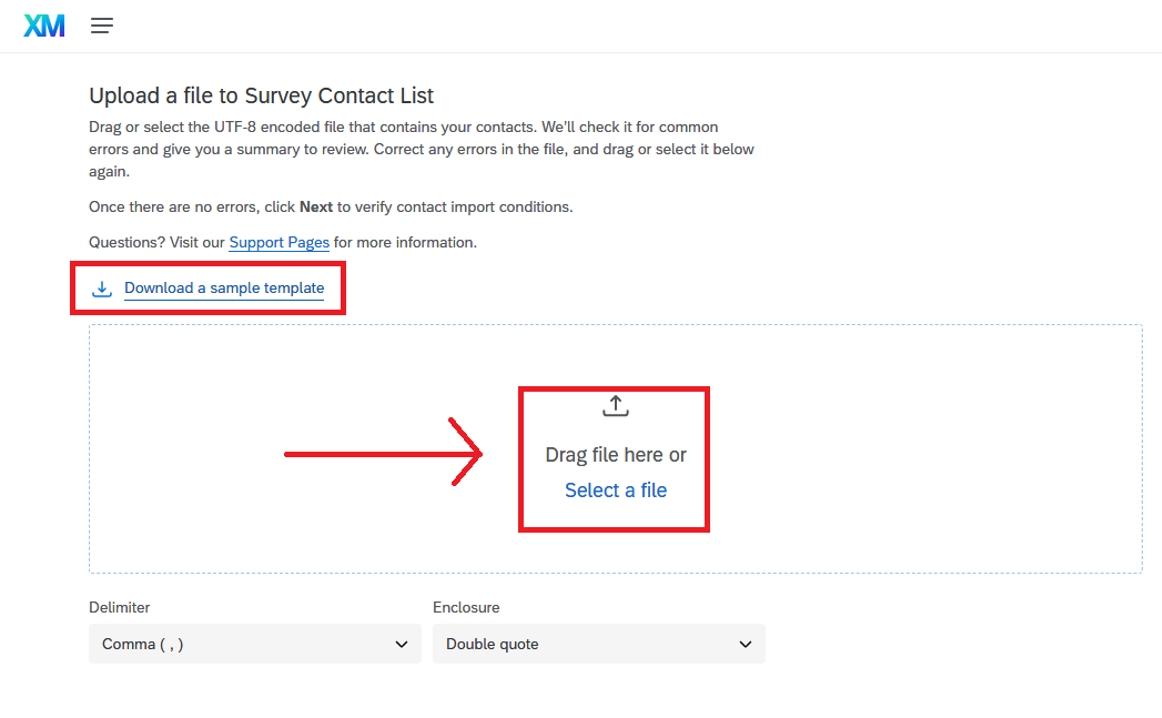
1. Click the “Upload a file” area.
2. Download the sample template, edit the file as needed, and upload it to add contacts.
3. Once you have selected the file to upload, click the “Next” button.
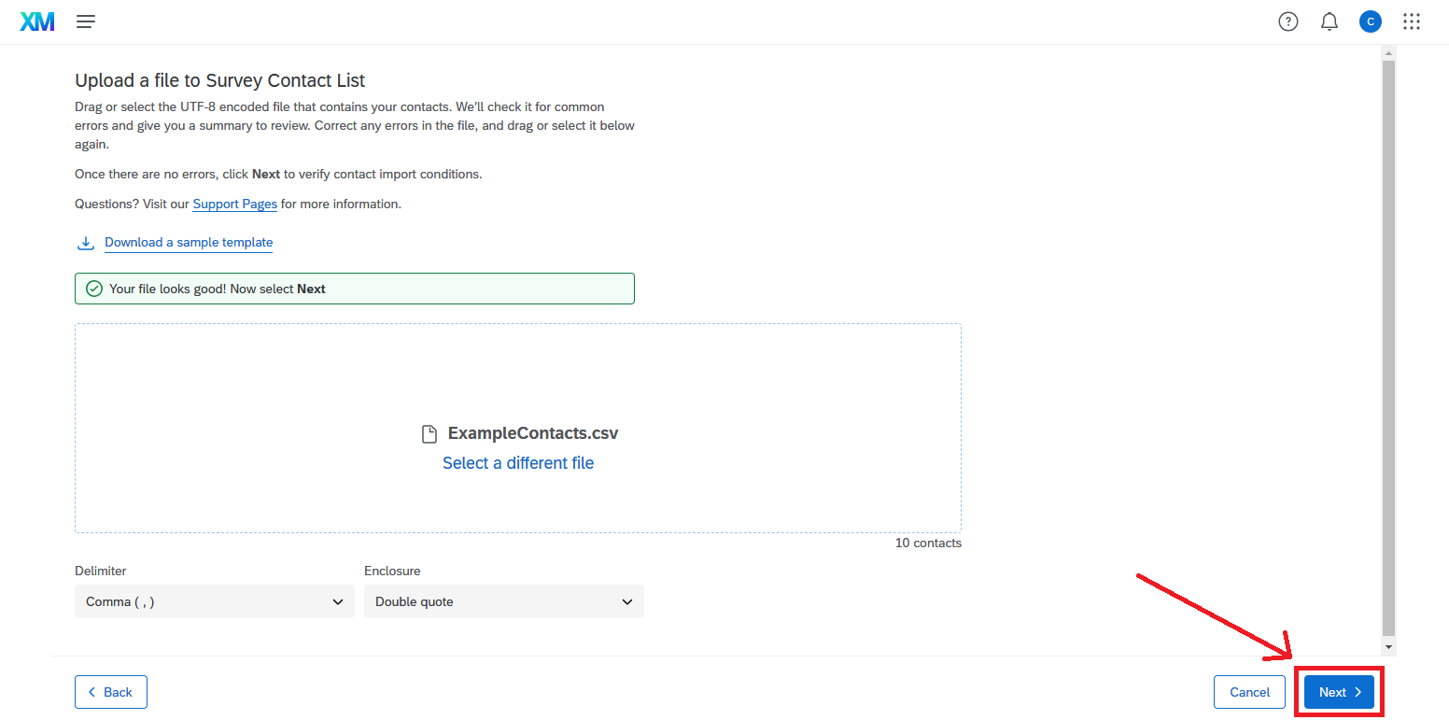
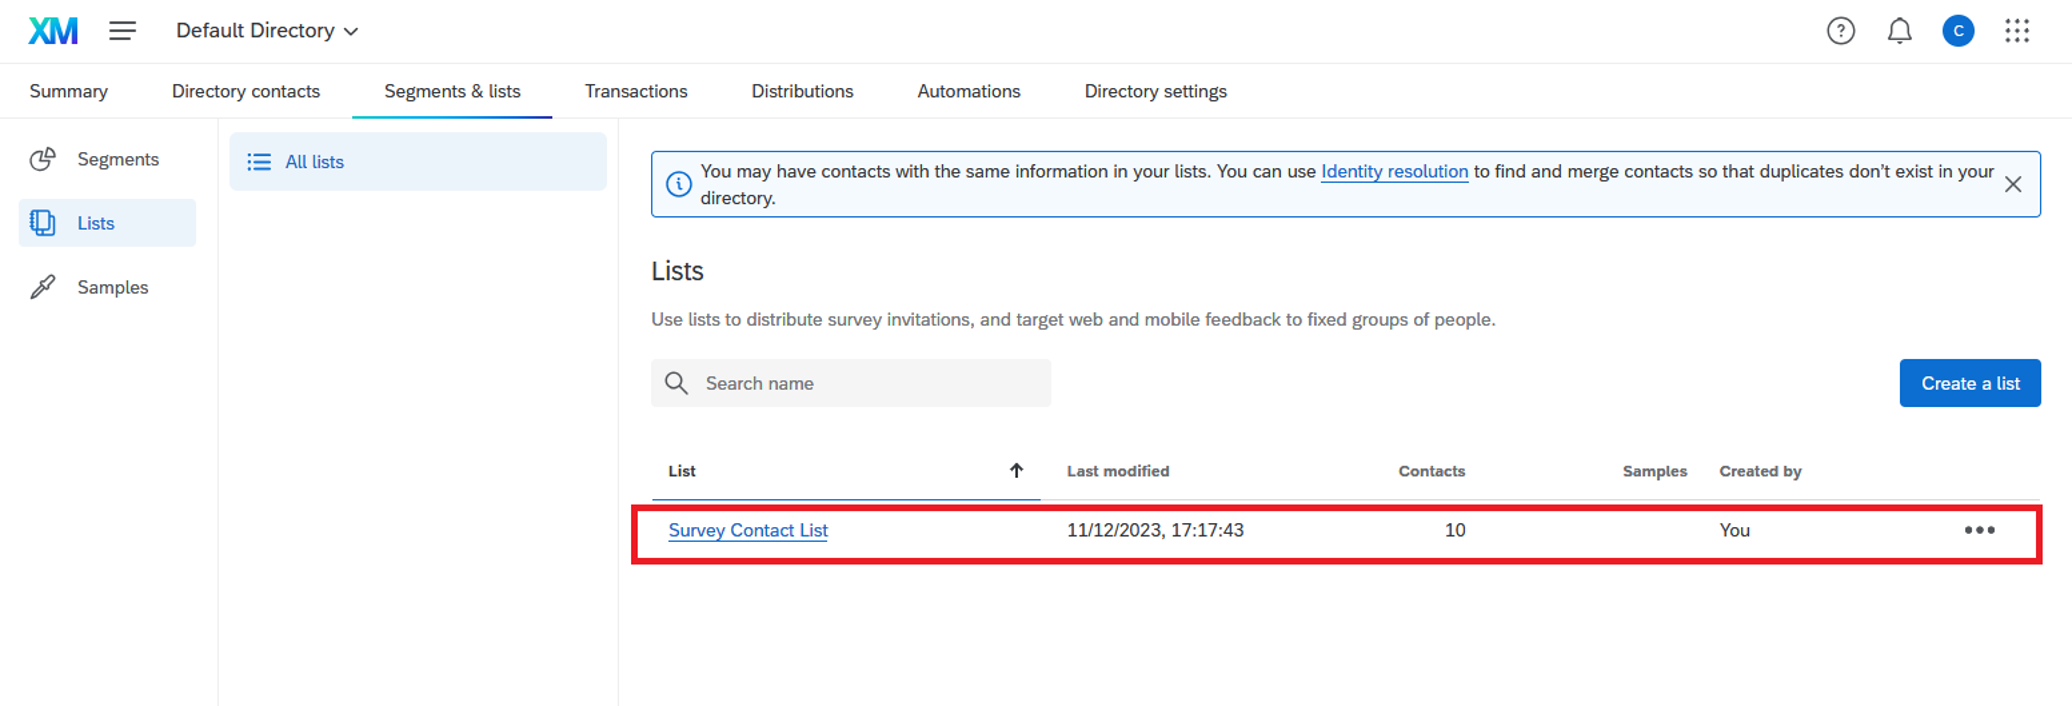
4. Your list is now ready.
Adding Email Contacts by Manual Input
1. To add email contacts manually, click the “Manual Input” button.
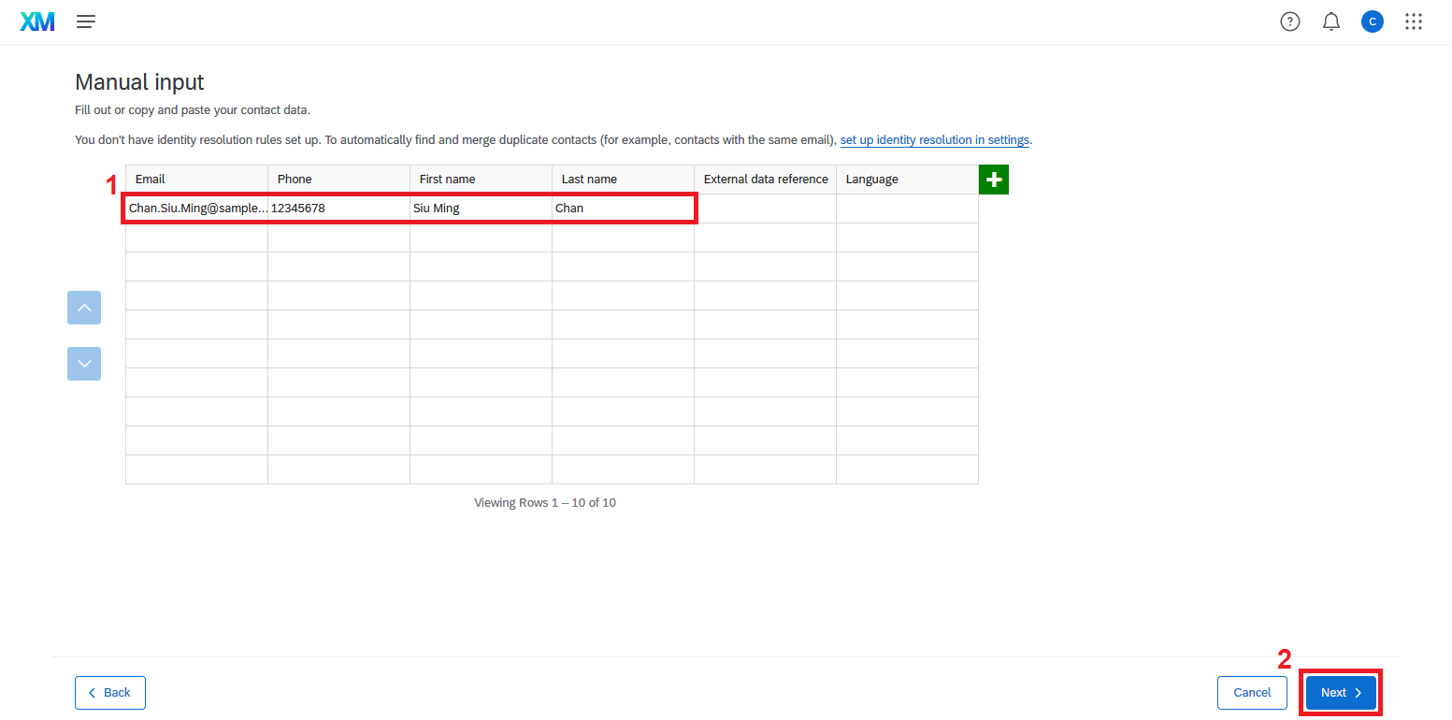
2. Enter the necessary information in the table provided, then click “Next” to proceed.
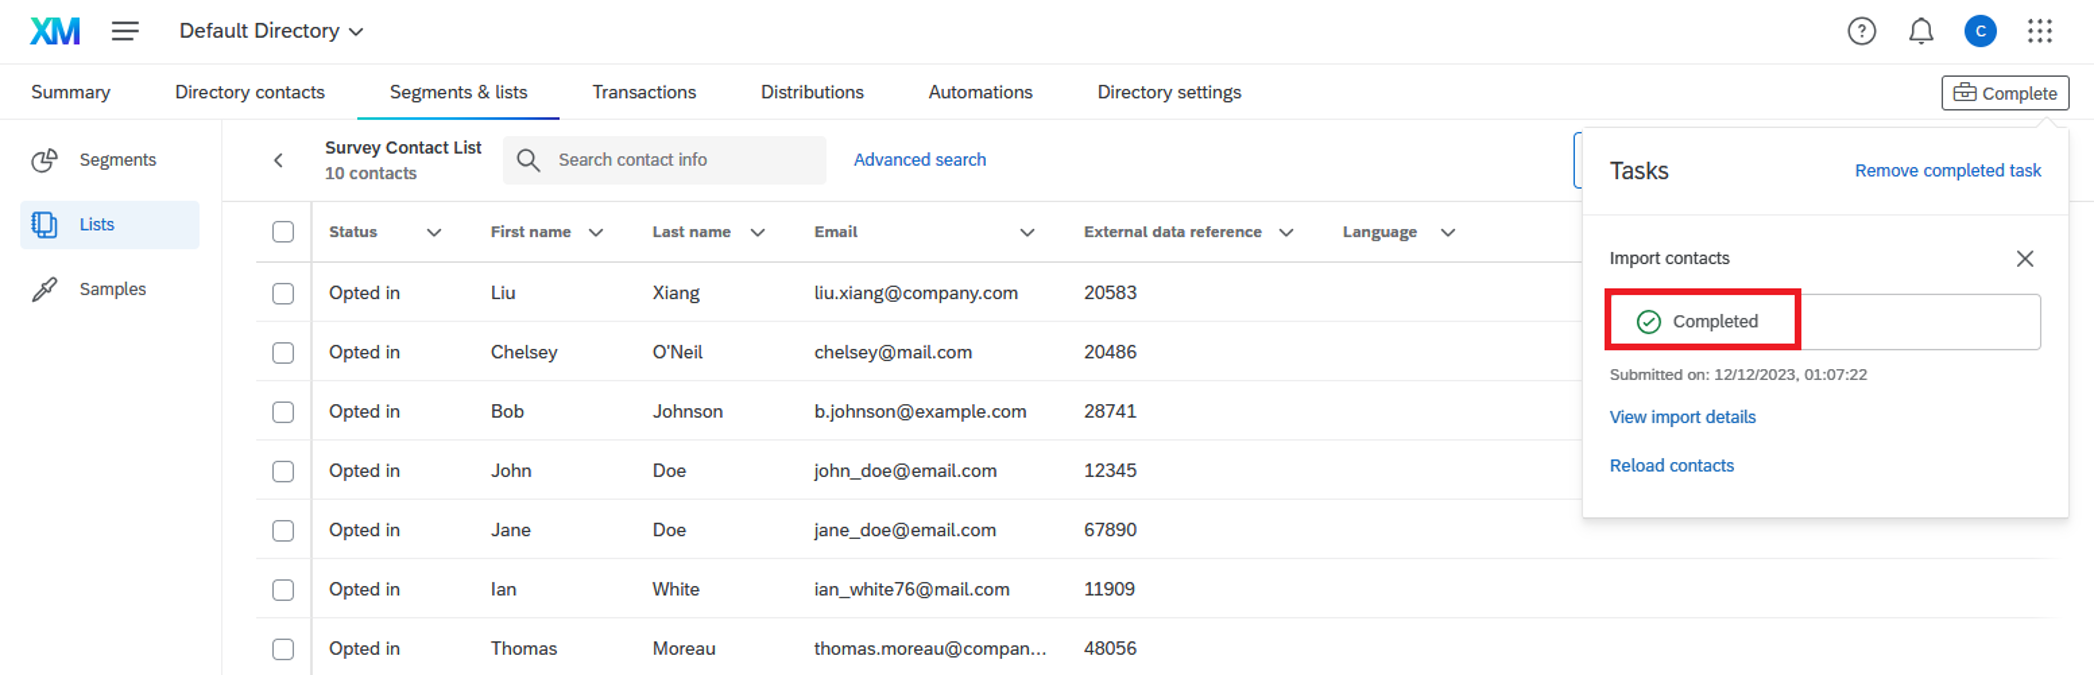
3. Wait for the request to be completed.
Setting Survey Availability
1. Click the fourth button – “Survey options”, and then click “Responses”.
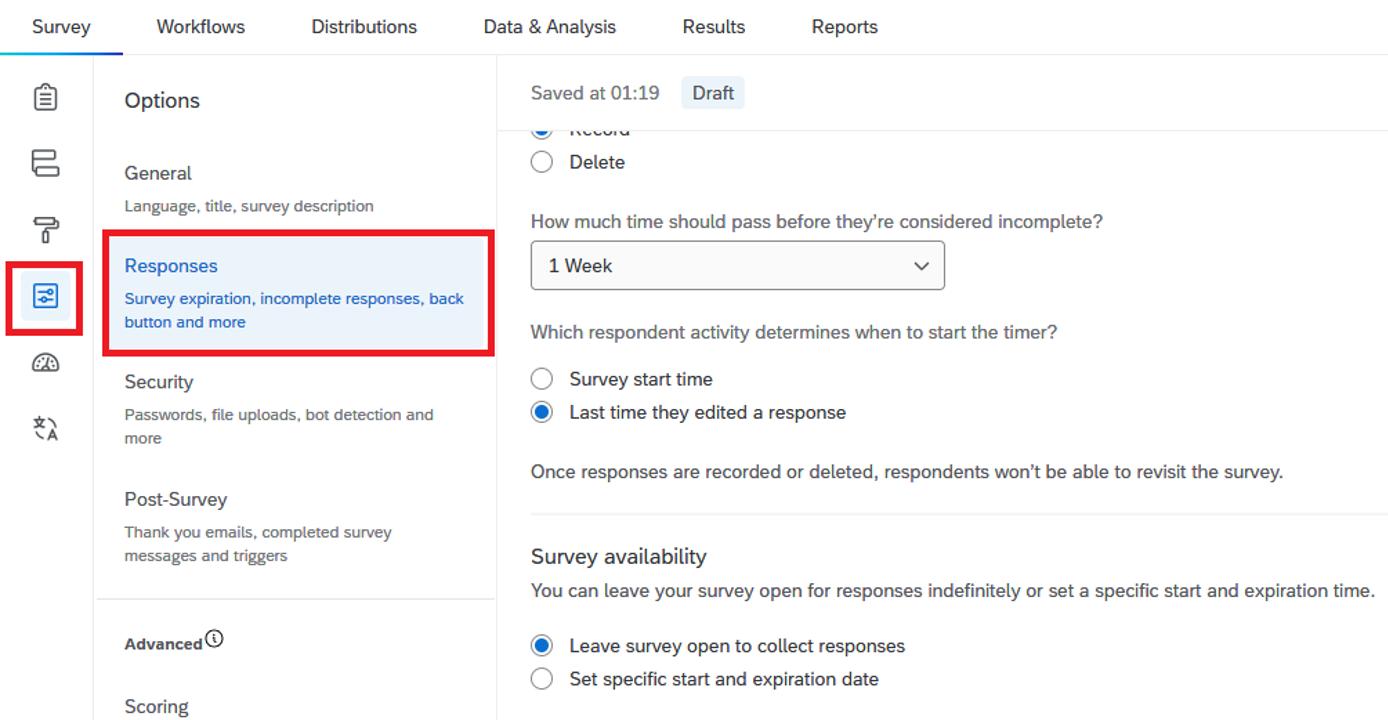
2. Scroll down to “Set specific start and expiration date” and “Edit survey availability” if needed.
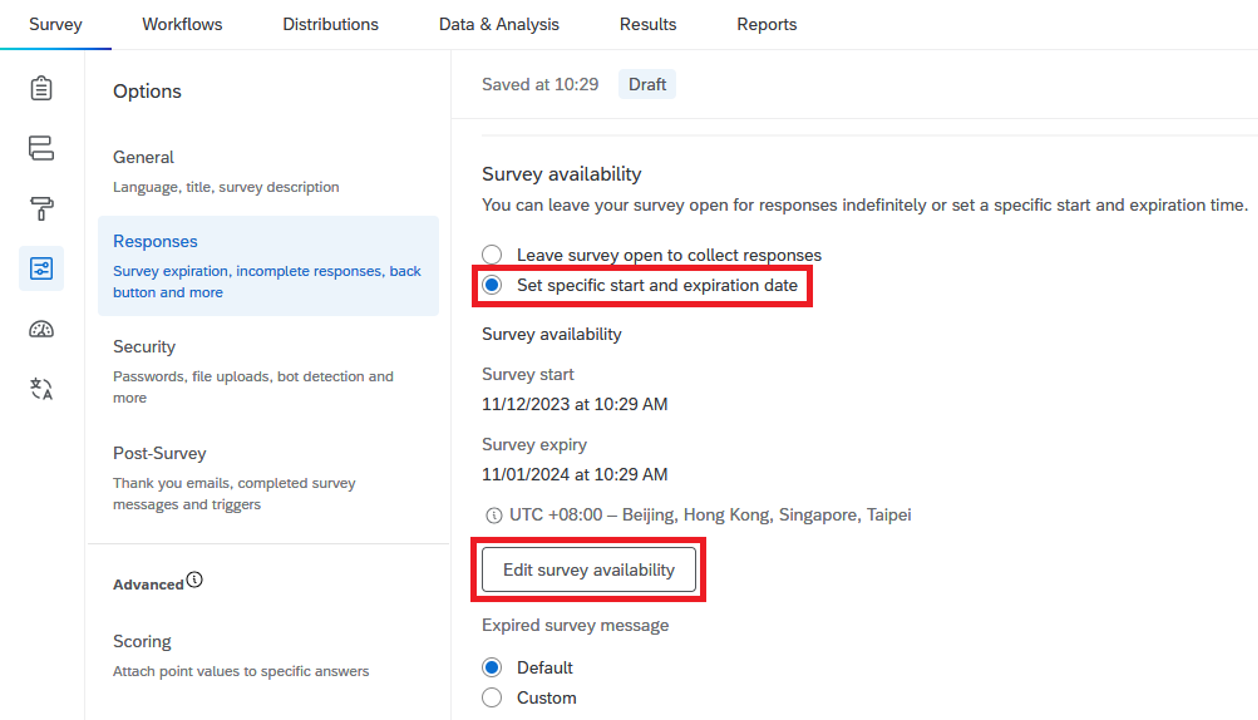
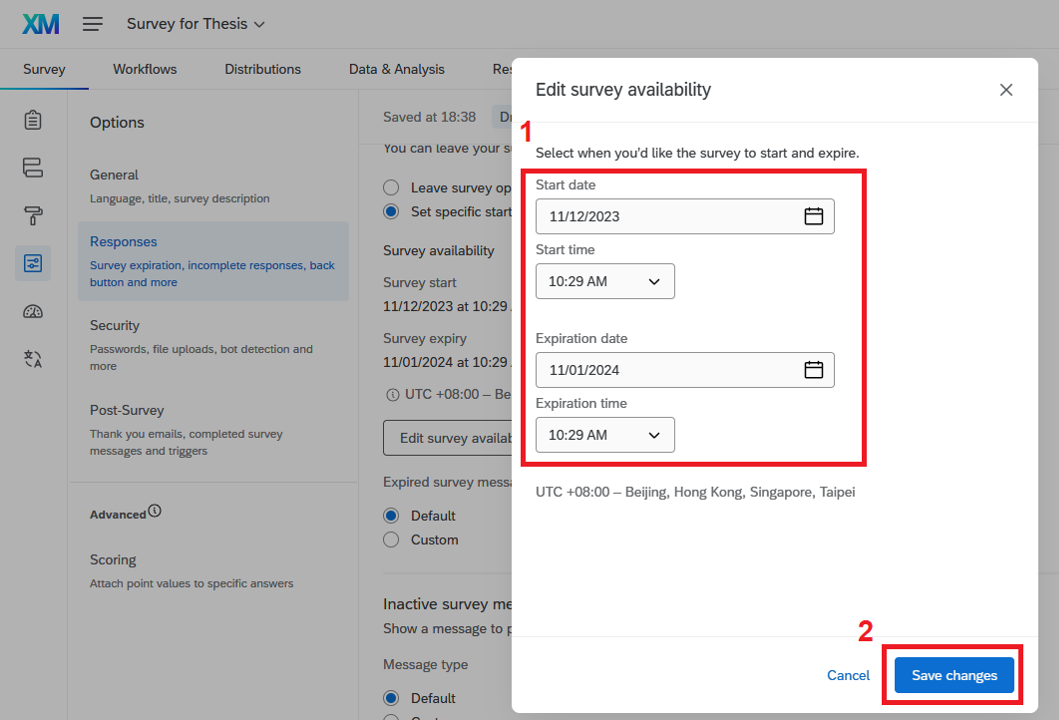
3. Click “Edit survey availability”, then set the start date, start time, expiration date, and expiration time as required. Click “Save changes”.
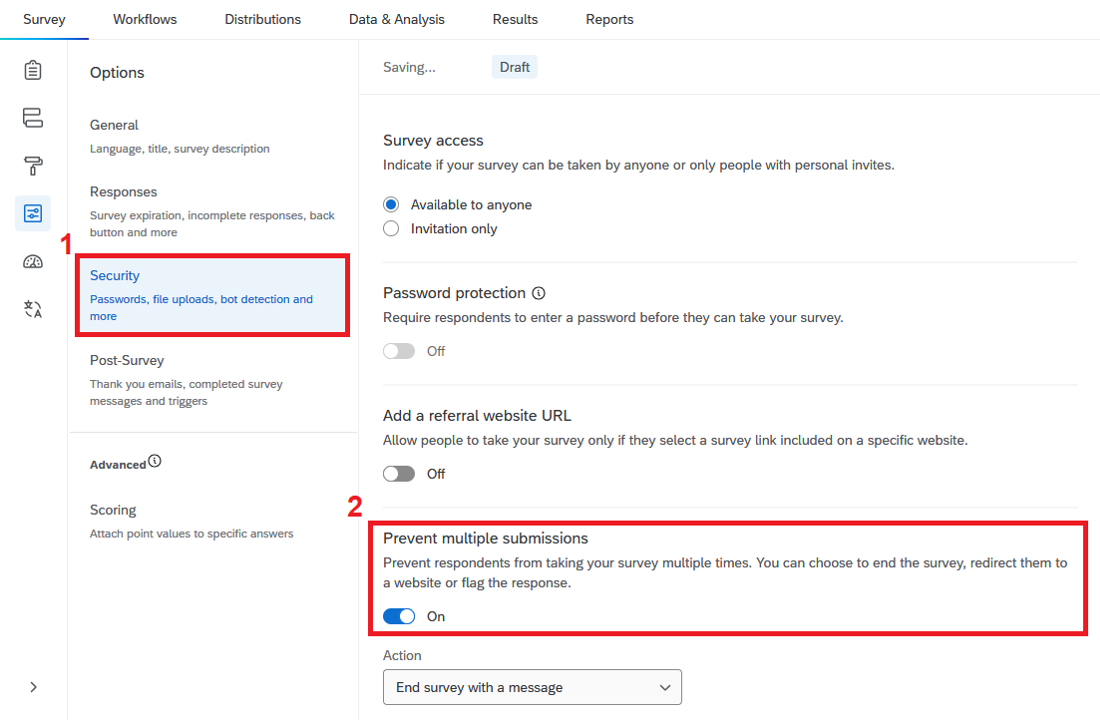
Preventing Multiple Submissions
Go to “Security”, then enable the “Prevent multiple submissions” option.
Activating the Survey
1. In the “Survey” tab, click “Publish”.
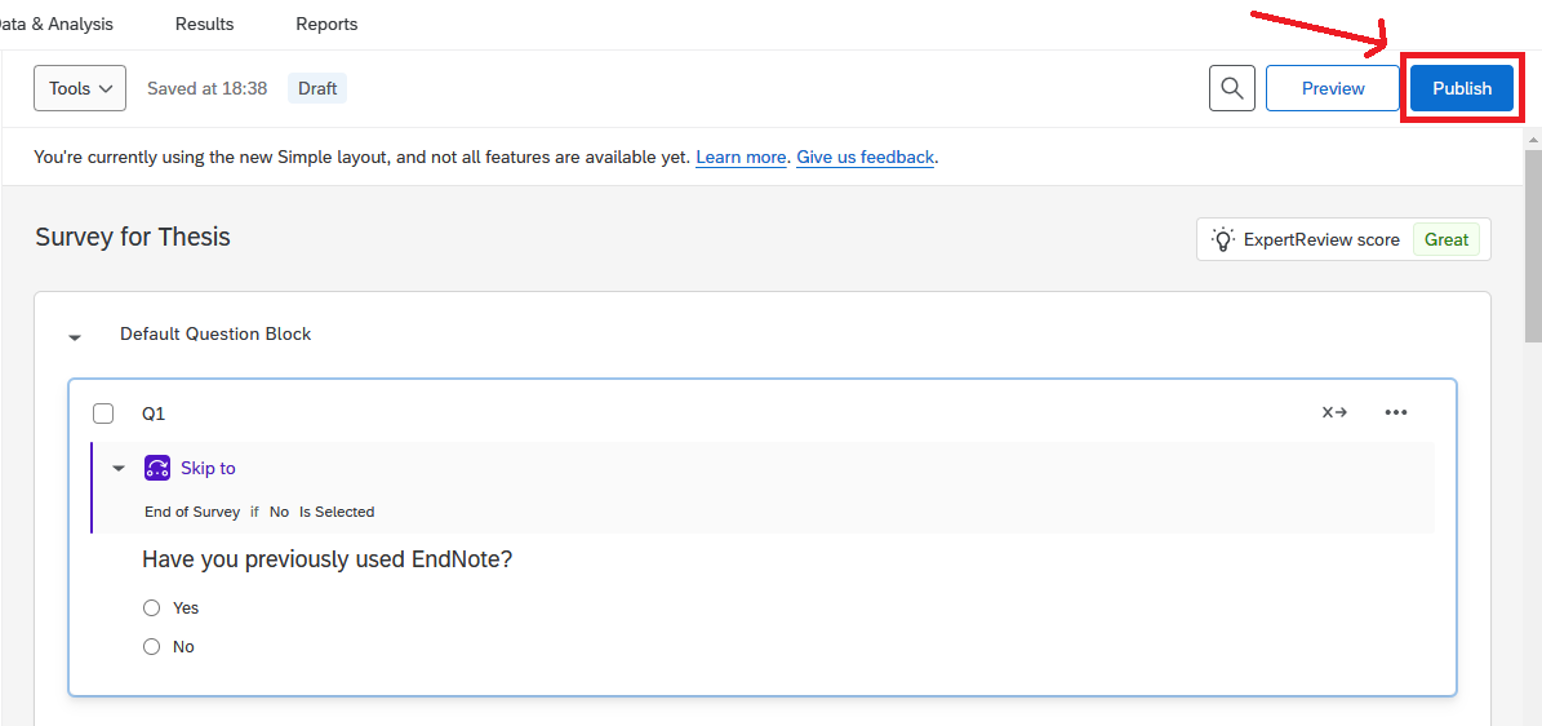
2. In the “Publish and activate survey” dialog, click “Publish” to activate your survey.
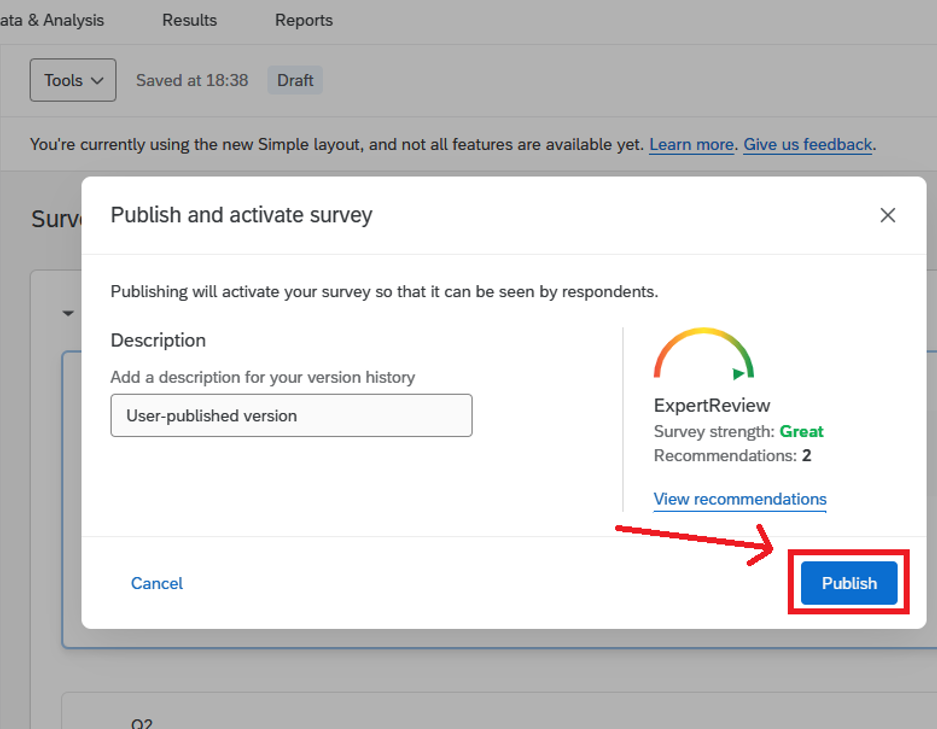
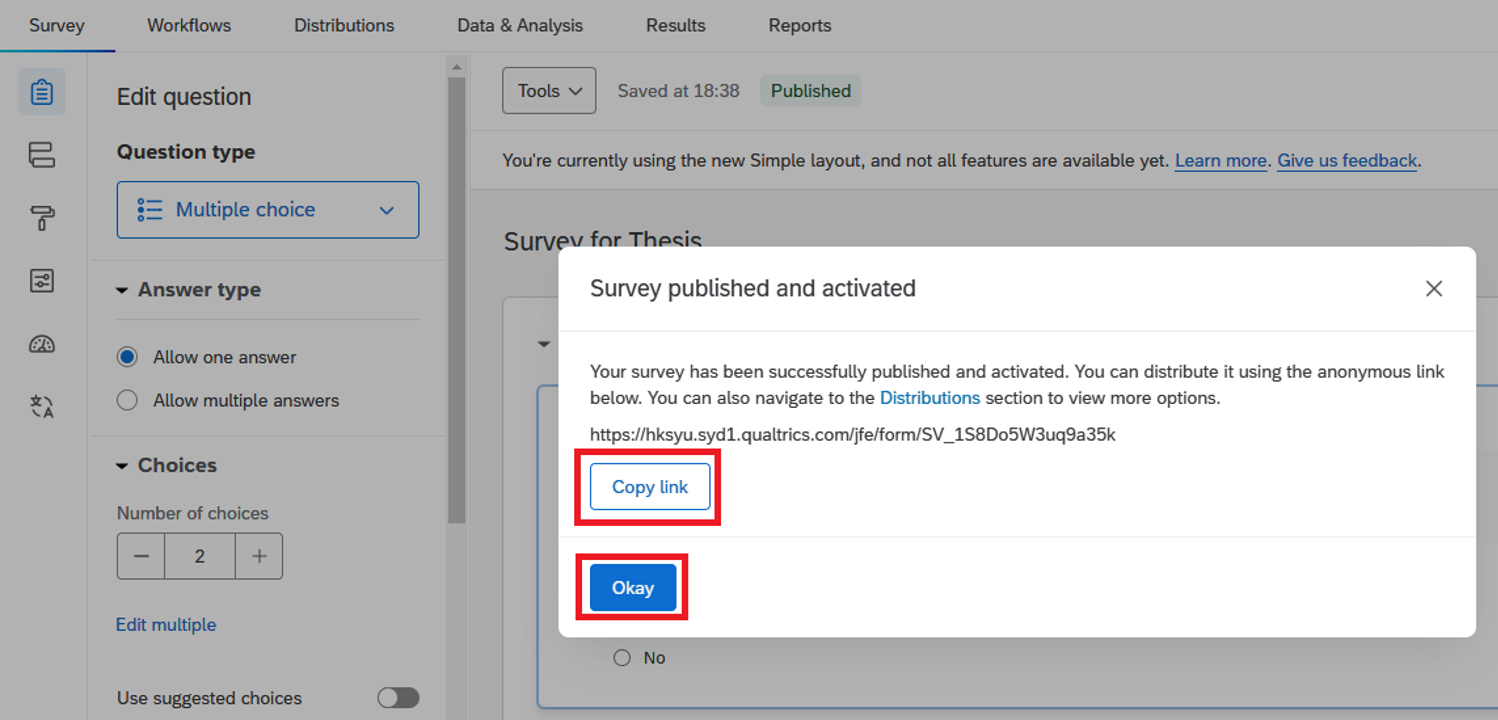
3. You may then copy the survey link and share it with your target respondents. Click “Okay”.
Distributing the Survey via Sending Survey Link
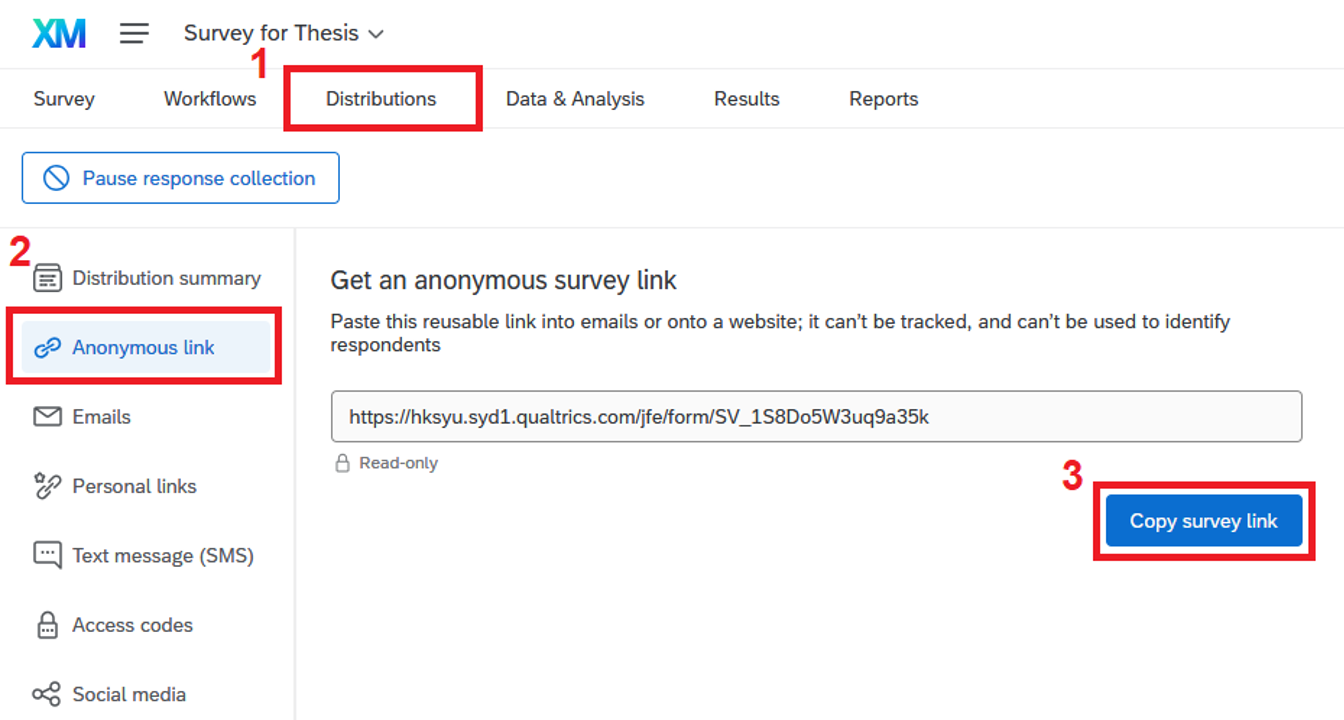
Once published, go to the “Distributions” tab and click “Anonymous link” to retrieve the survey link.
Distributing the Survey via Sending Emails
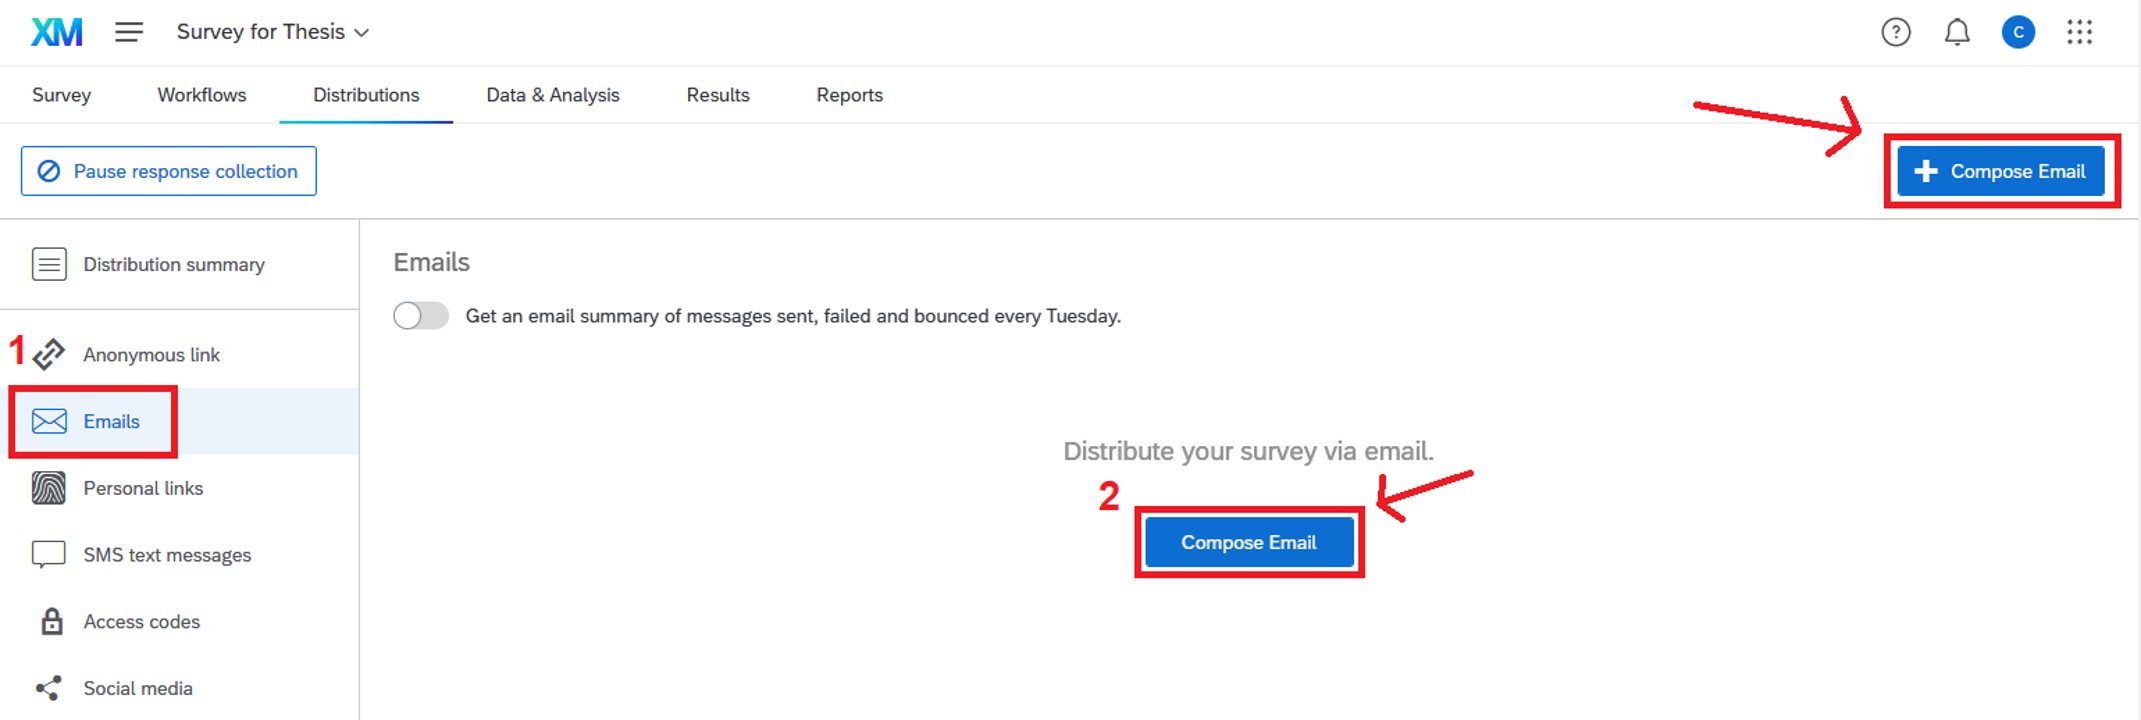
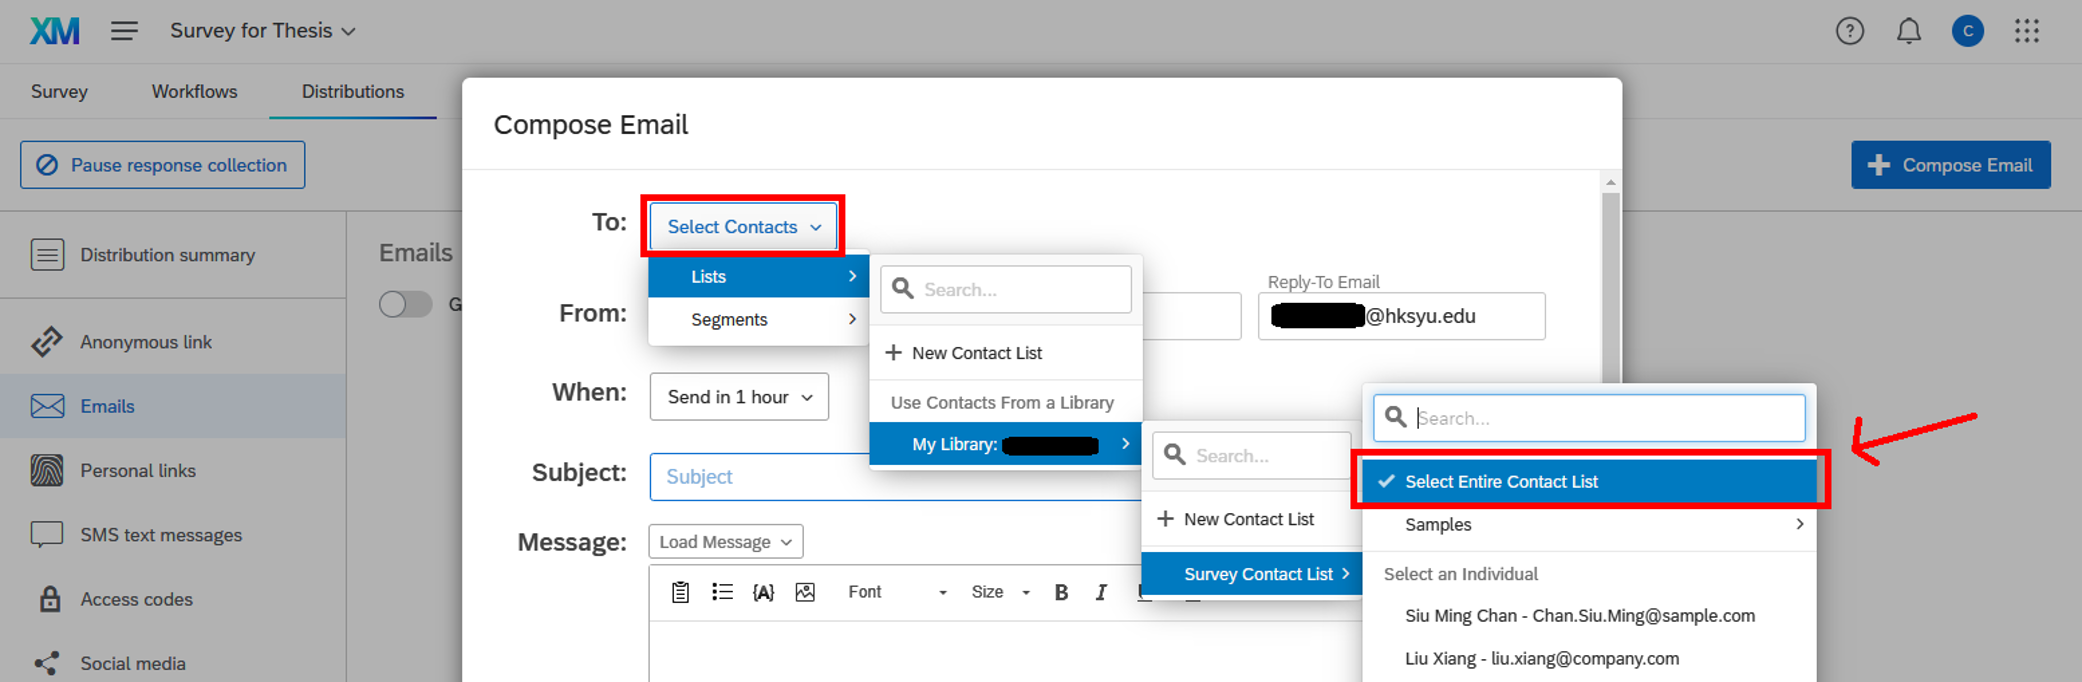
1. In the “Distributions” tab, click “Emails”, then click the “Compose Email” button.
2. Select: “Select Contacts” -> “Lists” -> “My Library:” -> “Select Entire Contact List”.
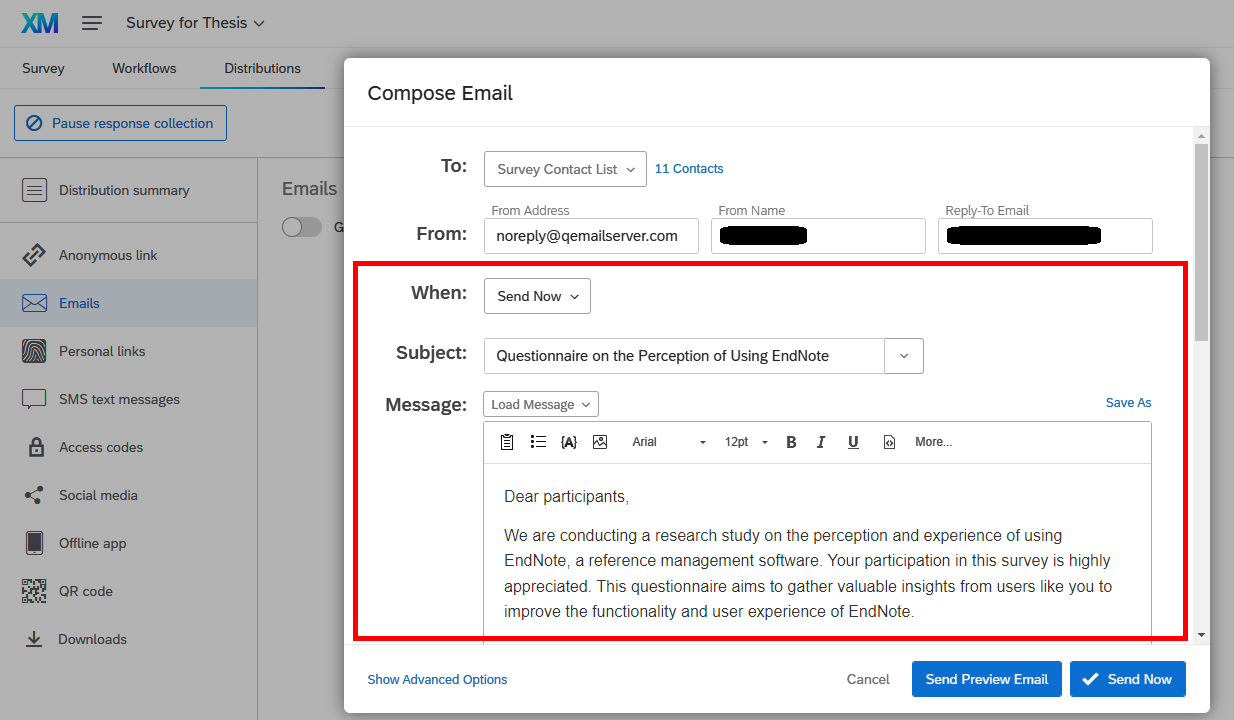
3. Customize your email by selecting the "Send Now" option under "When:”, entering the desired email subject, and editing the email message.
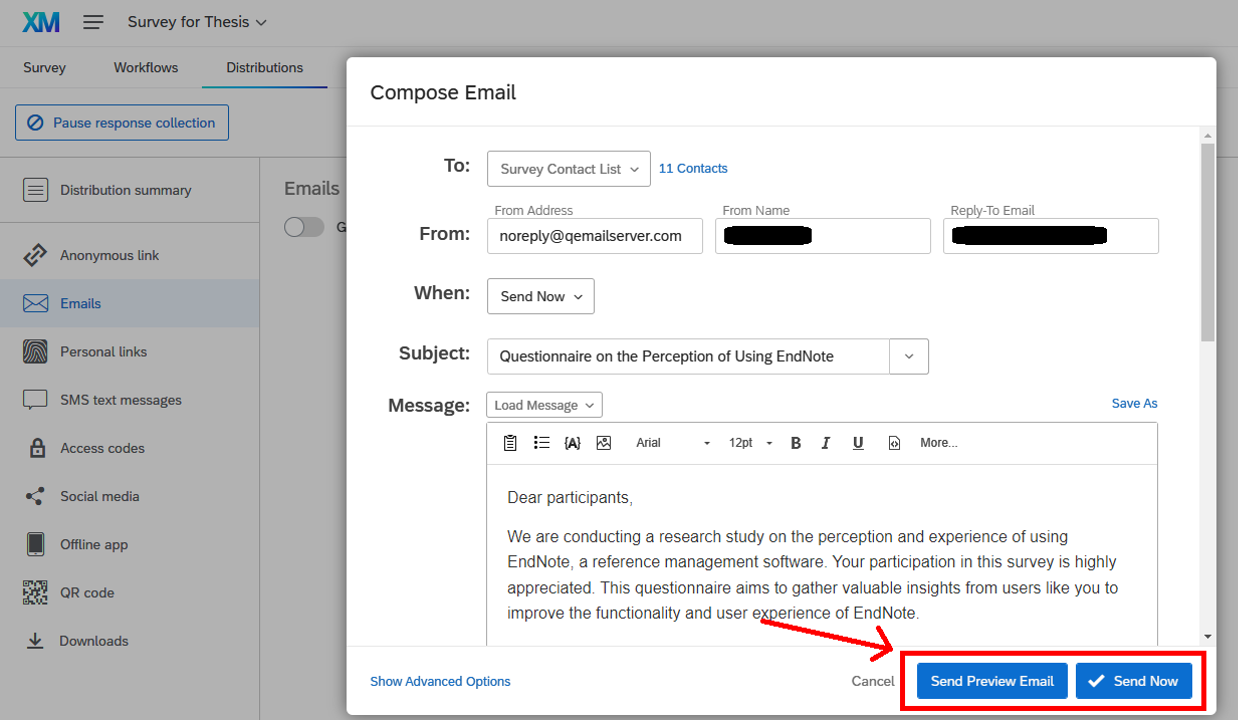
4. You can click the "Send Preview Emaill" button to send a preview to yourself, or use the "Send Now" or "Send in... hour" button to send the email to your target respondents.
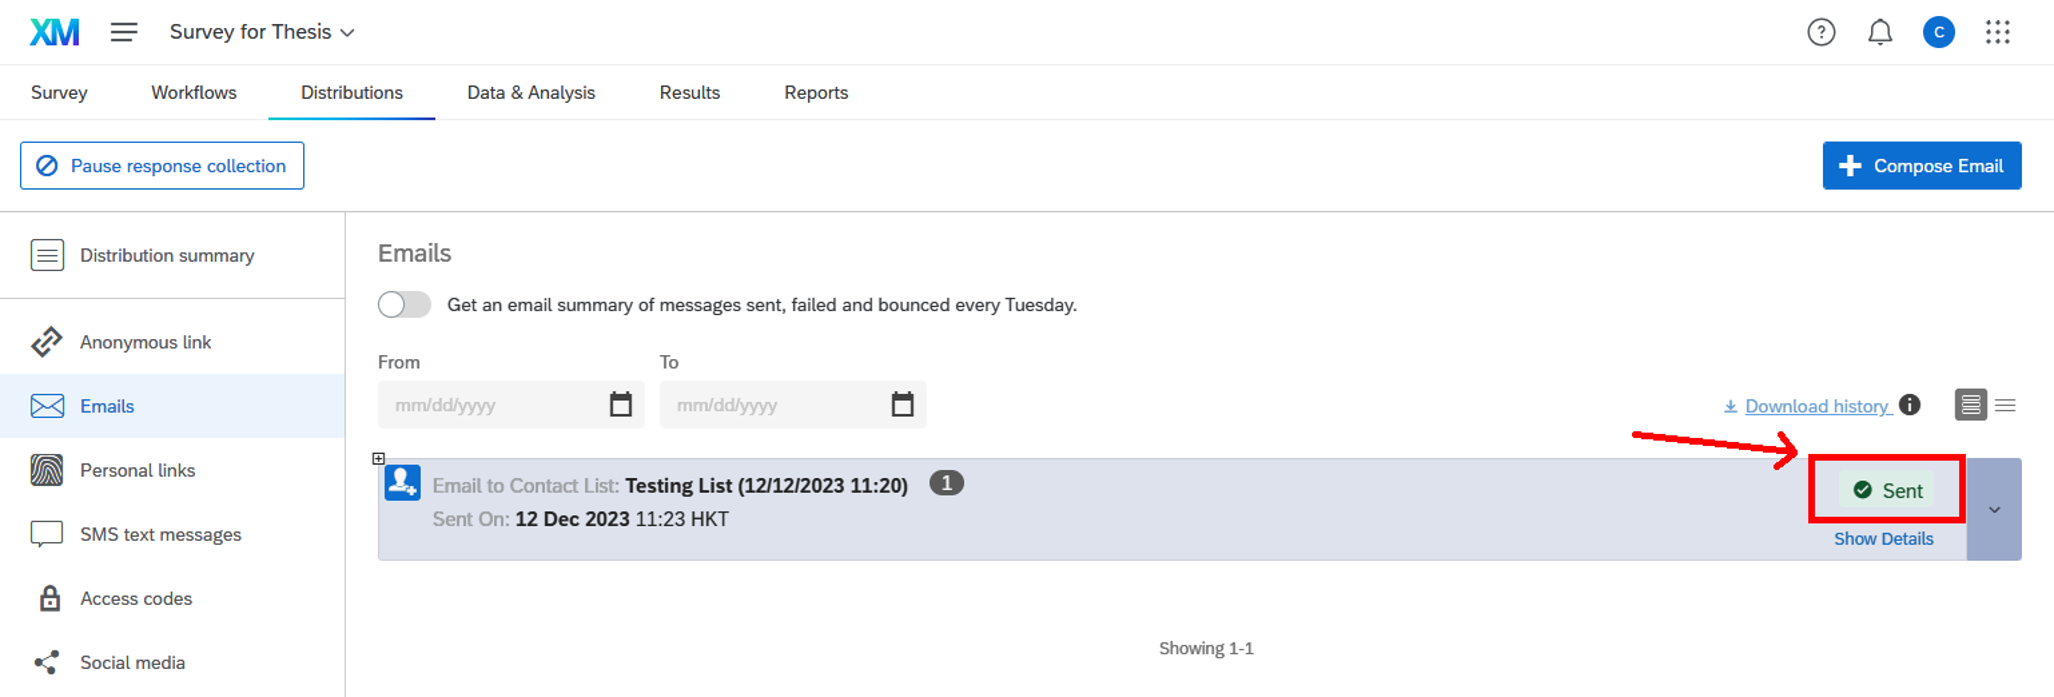
5. The page will refresh, showing the delivery status of the emails.
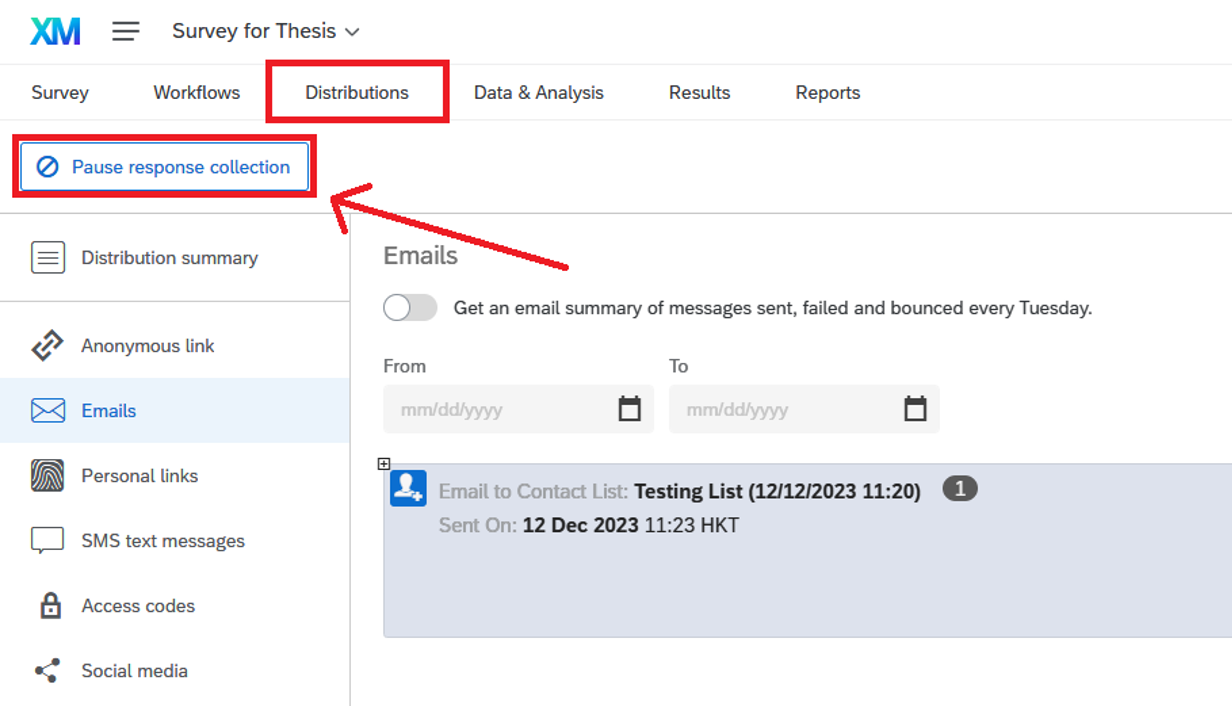
Closing the Survey
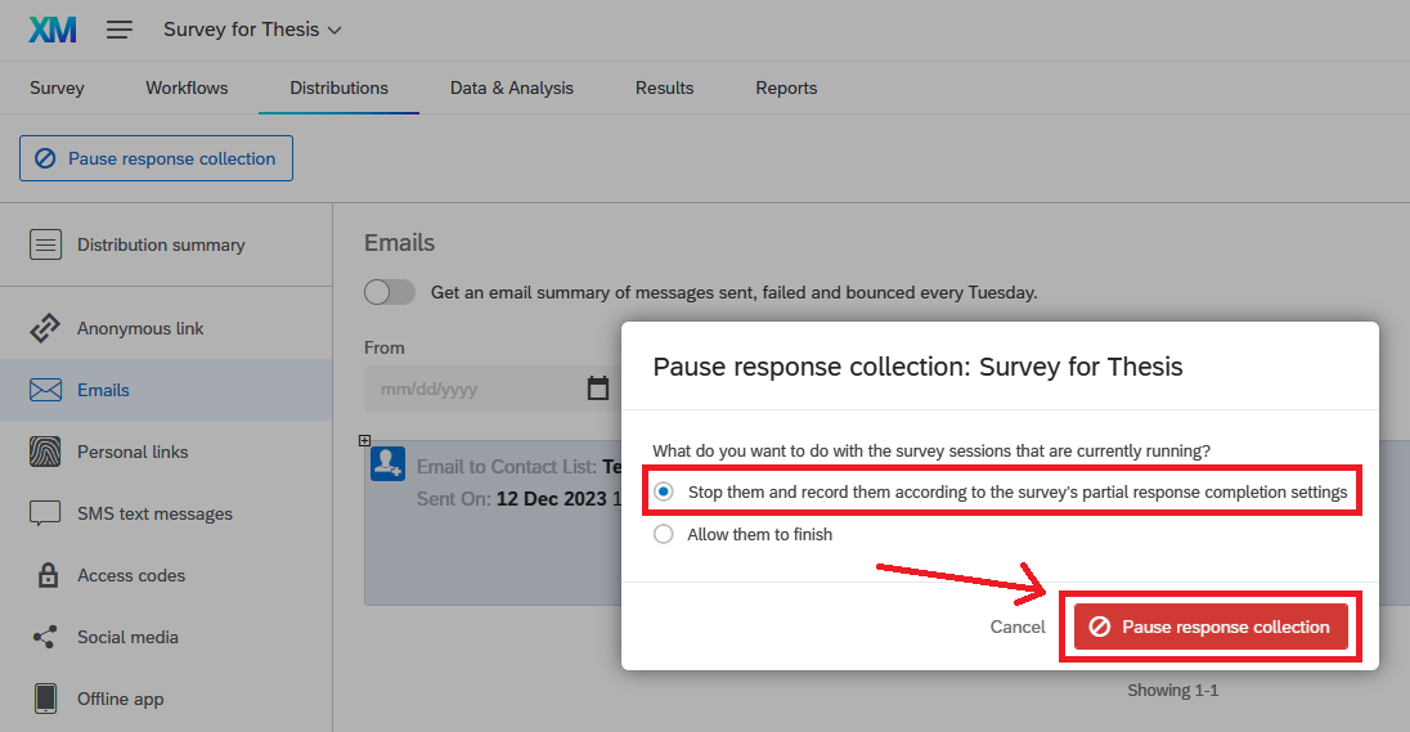
1. In the “Distributions” tab, click the “Pause response collection” button.
2. Select the option for unfinished survey sessions, then click “Pause response collection”.
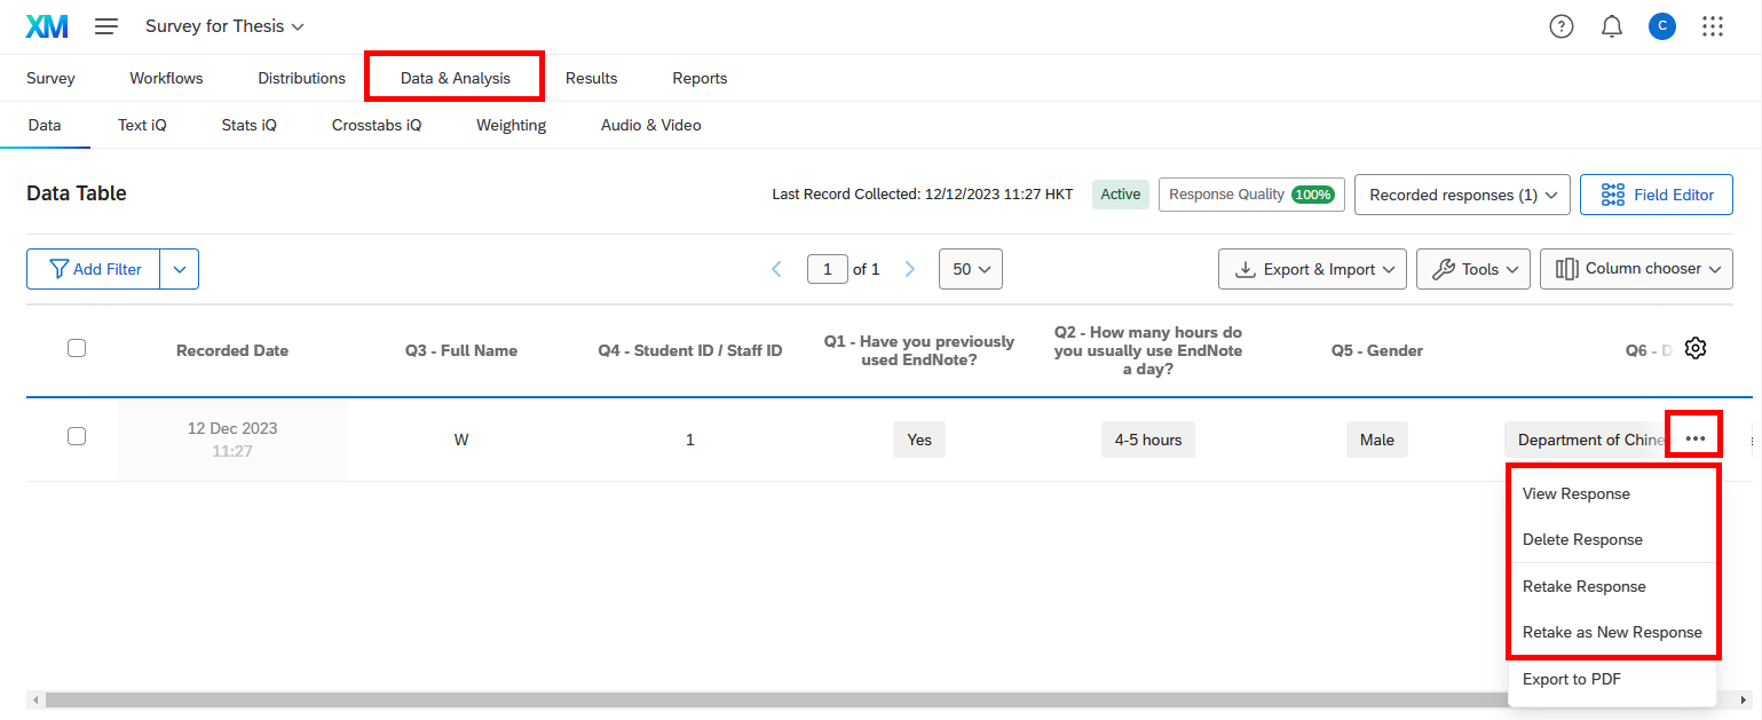
Viewing the Data
Go to the “Data & Analysis” tab. In the “Data” section, you can view, delete, or retake individual responses.
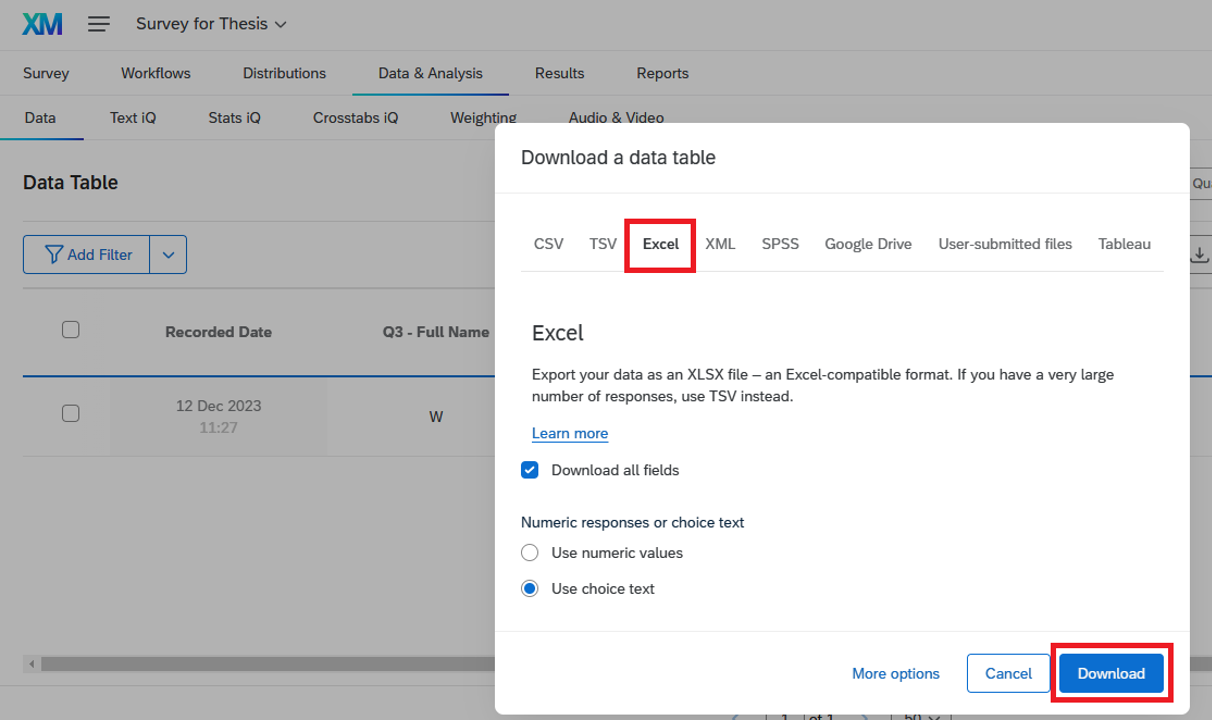
Exporting the Data
1. Click the “Export & Import” dropdown, then select the “Export Data…” option.
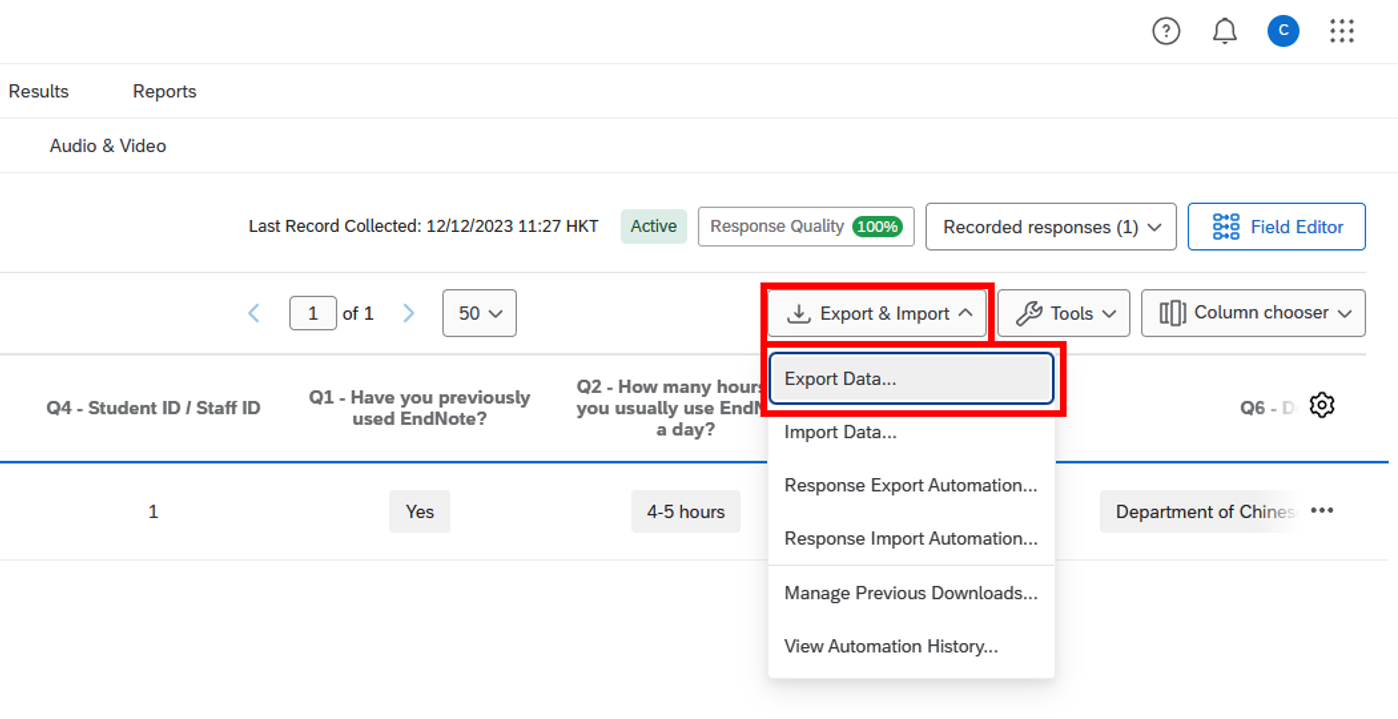
2. Select “Excel”, and then click the “Download” button. You may also choose to download the exported data in other formats, such as CSV, TSV, XML, SPSS, etc.
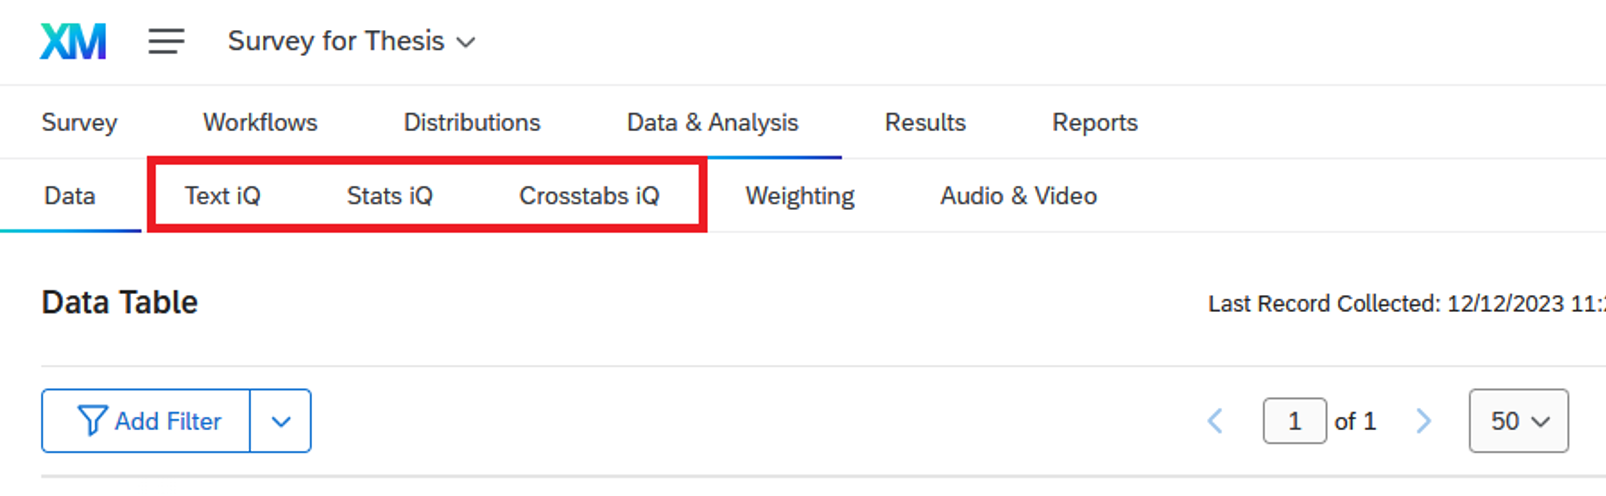
Analysing the Data
You may use “Text iQ”, “Stat IQ” and “Crosstabs IQ” to analyse your textural data.
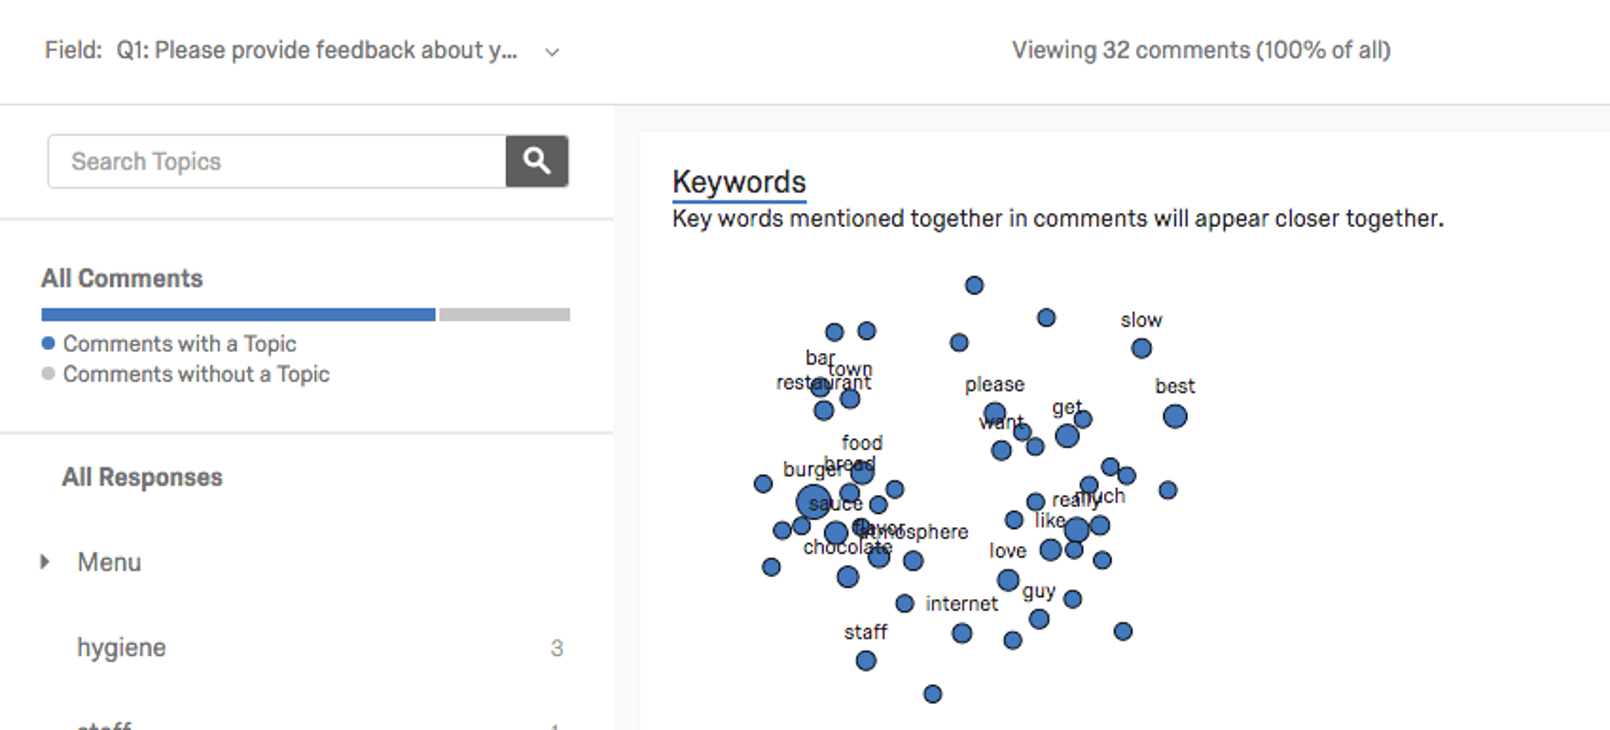
Text iQ
- Text iQ allows you to assign topics to feedback, perform sentiment analysis, and report results with dynamic widgets.
- For example, you can use Text iQ to tag text entry responses with topics for analysis.
- Text iQ generates various widgets that provide insights into your text analysis. For example, a constellation chart displays the frequency with which certain terms appear in all responses. Dots in the constellation grow larger as the term appears more frequently.
Stats iQ
Stats iQ allows you to conduct in-depth analyses, identify trends, and produce predictive models..
Crosstabs
- Crosstabs performs multivariate analysis (i.e., analysing two or more variables at a time) and calculates p-values, Chi-Square, and T-Test statistics.
- Typically used with multiple-choice and matrix table questions, you can also add embedded data to your crosstabs.
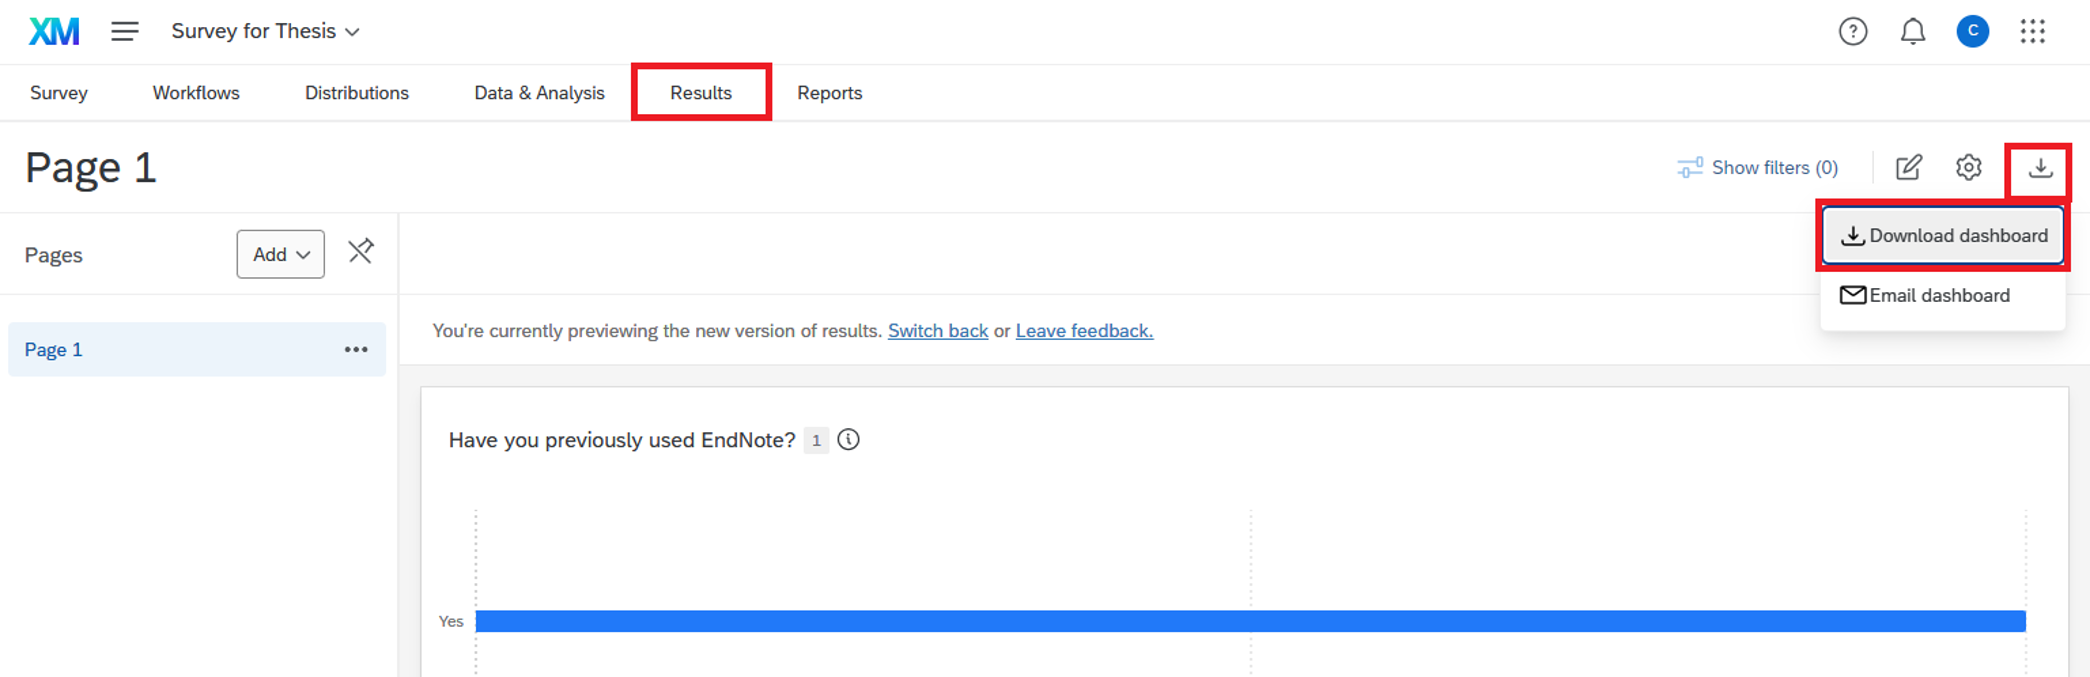
Showing the Results
Go to the “Results” tab. You may download the results in your preferred file format.
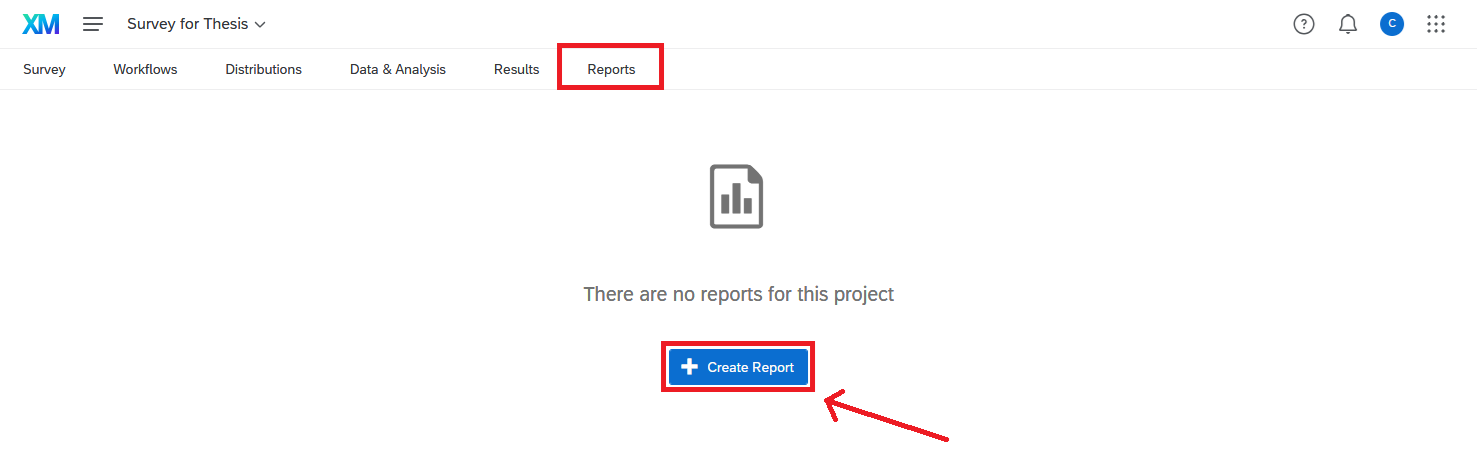
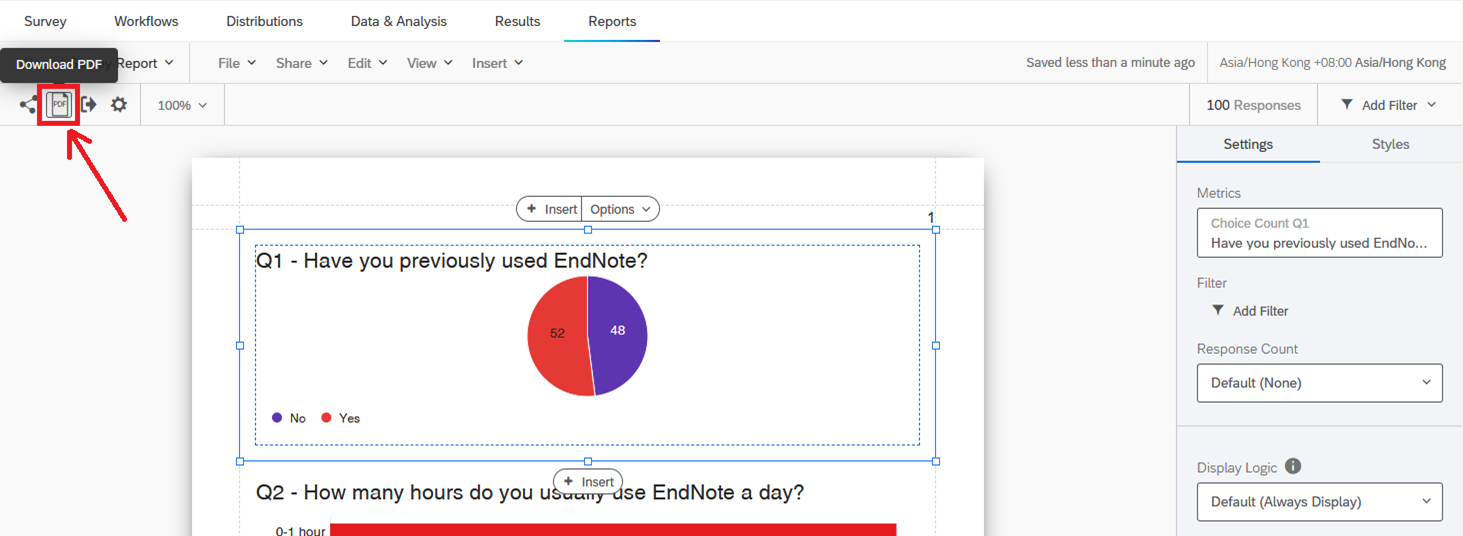
Creating Your Own Report
1. Click the “Reports” tab, then click the “ + Create Report” button.
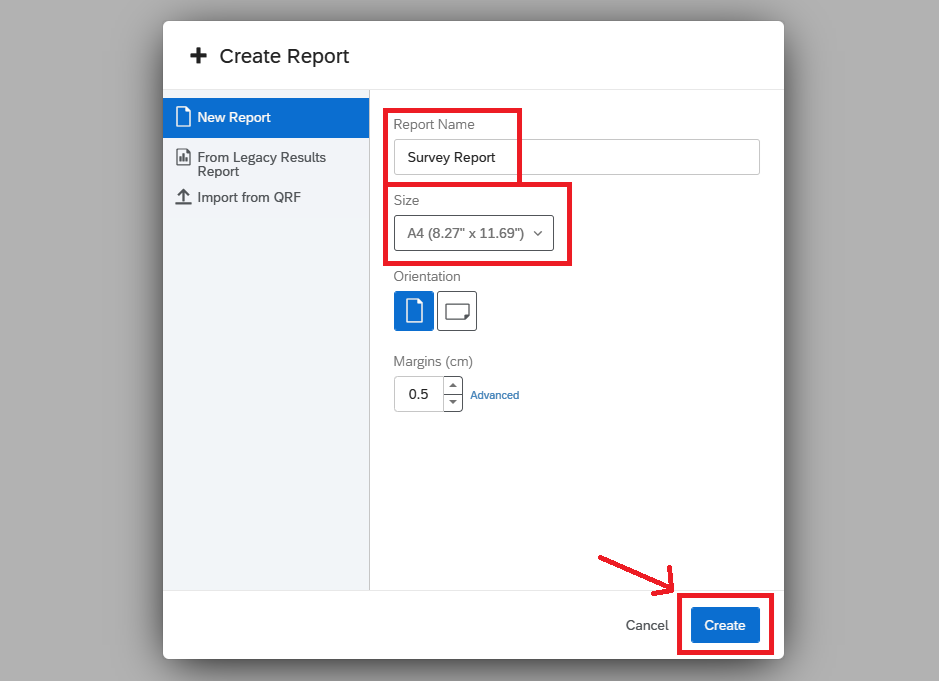
2. Enter the “Report Name”, change the size to A4, and then click the “Create” button.
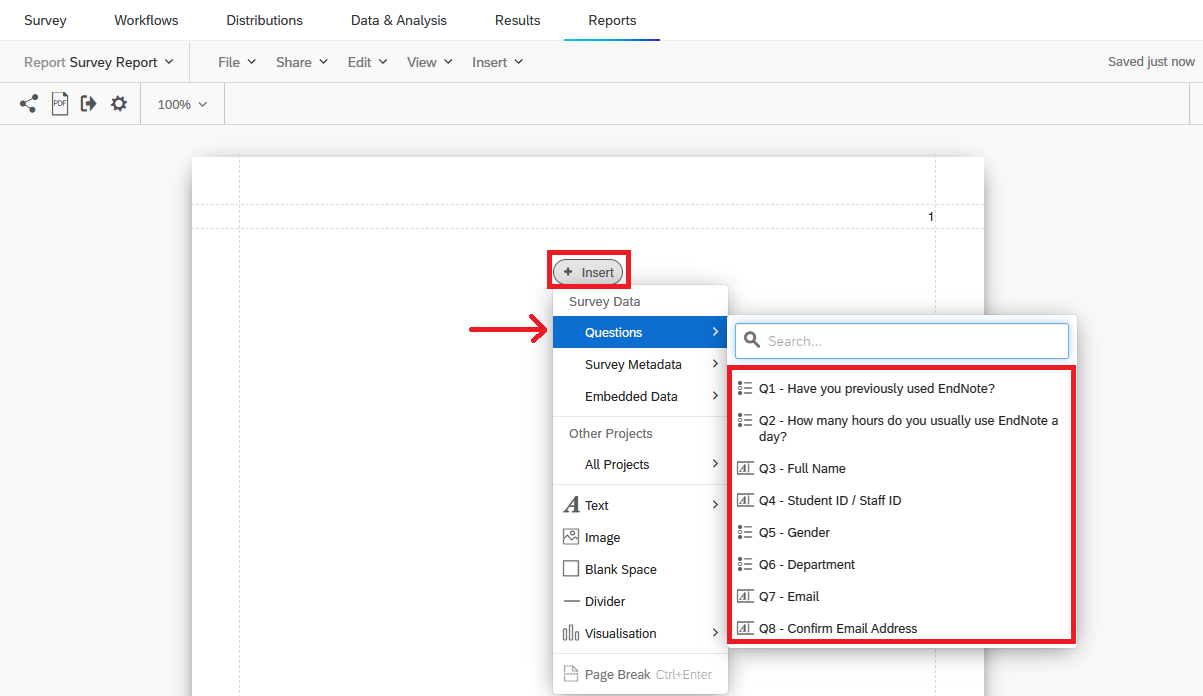
3. Click the “Insert” button at the center, then click the questions you want to add to the report.
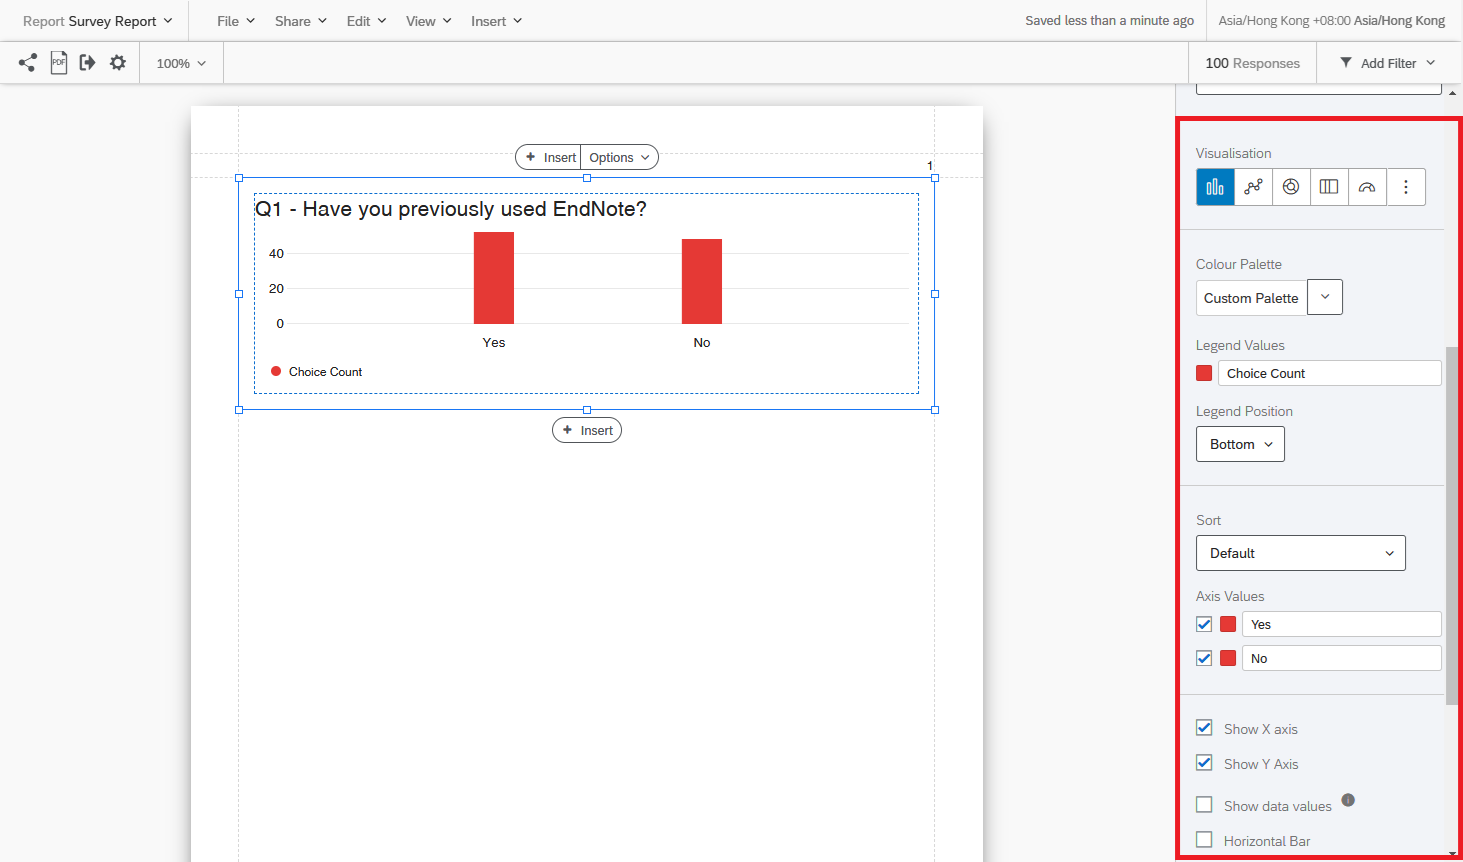
4. On the left panel, you may customise the chart, including visualisation, colour, axis values, etc.
5. Click the “Download PDF” button to export the report for further use.
- Project Basic Overview
The Projects page displays all the survey projects you have created, as well as those shared with you. From the Projects page, you can:
1) Create new projects.
2) Organise, sort, search, and view your projects.
3) Collaborate on or share projects with colleagues.
4) Identify your projects by their project type.
- Survey Basic Overview
Surveys are created and edited in the Survey Builder. This document introduces the basics of using the Survey Builder to create (add) and edit survey questions, including the functions available to customise your questions.
--- Features When Editing Questions or Formatting Answer Choices ---
○ Rich Content Editor
Allows you to add special formatting to your text. You can bold, underline, change colours and fonts, add hyperlinks, lists, tables, and even insert videos and images.
○ Pipe Text
Piped text is a feature that dynamically pulls text from a previous question, contact list information, or embedded data, and displays it in the current question.
○ Auto-Number Questions
If you prefer not to edit each question number individually, or if you want all your question numbers to be in order, you can use Auto-Number Questions. This feature sequentially orders all question numbers in your survey at once.
○ Adding Validation
Force response: Requires respondents to answer the question before continuing the survey.
Request response: Alerts respondents about unanswered questions but allows them to continue without answering if they choose.
Custom validation: Forces a specific type of response, such as an email address, telephone number, or numbers within a certain range.
○ Pre-Made Qualtrics Library Questions
In addition to survey templates, Qualtrics provides common questions you can add to almost any survey, such as demographics or questions used in higher education.
○ Adding Page Break
By default, your survey questions are displayed together on one page. To prevent survey fatigue and improve the respondent experience, you can break your survey into multiple pages.
○ Previewing Question
You can preview how a single question (question preview) or a block of questions (block preview) will appear to respondents without previewing the entire survey.
○ Suggested Choices
Qualtrics offers suggested choices to help you build questions. These include answer choices for common survey questions, such as demographics or satisfaction ratings on a standardised scale.
○ Additional Features to enhance Answer Choices
A dropdown menu provides additional features to enhance your answer choices, including "Allow Text Entry, Text Entry Size, and Text Entry Validation", "Insert Graphic", "Exclude From Analysis", "Insert Piped Text", "Add Display Logic", “Make Answer Exclusive”, and "Assign to Group".
--- Others: Basic Features ---
○ Skip Logic
Skip logic allows you to send respondents to a later point in the survey based on their answers. For example, if a respondent does not agree with your survey’s consent form, they can be automatically directed to the end of the survey.
○ Display Logic
Display logic allows you to customise your survey for each respondent. You can conditionally display questions or answer choices based on previous answers, ensuring that only relevant content is shown.
○ Editing the End of the Survey
Customise your thank-you message, redirect respondents to another webpage, or anonymise their response after survey completion using the end-of-survey settings.
--- Others: Advanced Features ---
○ Choice Randomisation
Randomise the order in which answer choices are presented to respondents.
○ Carry Forward Choices
Carry Forward Choices allows you to copy specific answer choices from one question for use in another. For example, after respondents select multiple options, you can carry forward their selected choices to a follow-up question for ranking.
○ Default Choices
Pre-populate answer choices within a question when the respondent opens the survey.
○ Recode Values
Recode values are the numeric values assigned to answer choices, while variable names are the labels used when exporting in choice text format. By default, the first answer choice has a recode value of 1, the second 2, and so on. You can modify these to align with your statistical analysis needs.
○ Scoring
If you are creating a quiz or test, you can use scoring to assign point values to specific answer choices. These points are summed to give the respondent a final score.
--- Features for Final Checking ---
○ Previewing Survey
Once you have finished building your survey, you can preview it to ensure everything works as intended.
○ Generate Test Responses
Generate random dummy data to see how your dataset or reports will look before distributing your survey.
○ Setting Up Quotas of the Survey
Quotas allow you to track how many respondents meet certain conditions in your survey.
○ Look & Feel
Customise the appearance of your survey, including Survey Theme, Brand (logo, background image, header, and footer, etc.), Survey Layout, Specifying Questions per Page, Next and Back Button Text, Colours, Fonts, Survey Motion (e.g. Page Transition Animation, Survey Autoadvance, Autofocus), as well as adding a Progress Bar.
○ ExpertReview
ExpertReview acts as a digital reviewer for your surveys. It measures the data quality of survey elements, recommends improvements, provides documentation with research-based explanations, and predicts the quality of collected data.
○ Translating a Survey
You can add multiple languages to a single survey. Each respondent can view the survey in their preferred language, and all results will be consolidated into a single dataset.
- Distributions of Survey
This document explains how to publish your survey using the Distribution tab, the various channels and methods available to distribute your surveys to target audiences (e.g., email distribution via anonymous or tracked links, web distribution, social media distribution, mobile distribution through SMS invitation, etc.), how to manage distributions, how to enable and pause survey responses, and more.
○ Vanity URLs
Vanity URLs allow you to modify the domain, such as the link as hksyu.edu/research/survey/SV_1234567890. This enables you to apply your own branding across multiple touchpoints, including survey links, dashboard invitations, and more.
○ Email Distributions
You may use either the Qualtrics mailer or your own email system to send custom survey invitations. You can distribute your surveys using reusable anonymous links or traceable personal links. A contact list is required to use this method.
→ Reminder & Thank You Emails
After inviting respondents to take your survey, Qualtrics allows you to send reminder emails to encourage completion or thank-you emails after they have finished.
○ SMS Distributions
You can also send individualised survey links to your respondents via SMS. Since each link is unique, it will save all the respondent’s contact information and embedded data with their response.
○ Social Media Distributions
The Social Media section in the Distributions tab makes it easy to post your survey to social media platforms. Qualtrics currently supports Facebook, X (formerly Twitter), Reddit, LinkedIn, and Pinterest.
- Data & Analysis Basic Overview
The Data & Analysis tab in Qualtrics enables you to filter, classify, merge, clean, and statistically analyse your response data. This section provides an overview of the key analytical tools and reporting features available.
○ Text iQ
Use Text iQ to tag text entry responses with topics for analysis. The Text iQ search helps you quickly locate topics, while lemmatisation and spell check speed up the topic tagging process.
○ Stats iQ
Stats iQ allows you to perform in-depth analysis, identify trends, and build predictive models based on your survey data.
○ Crosstabs
Crosstabs enable multivariate analysis (i.e., analysing two or more variables simultaneously) and can calculate p-values, Chi-Square, and T-Test statistics. This tool is typically used with multiple-choice and matrix table questions, and you can also add embedded data to your crosstabs. Additional options allow you to filter statistics, adjust confidence levels, and share your data with others. - Survey Results (Simple Report)
The Results-reports tab provides a quick and straightforward visualisation of your survey results. Each question in your survey is automatically visualised, and you can further edit or add visualisations to your results pages.
○ Breakouts
Group your visualisations by multiple questions or fields. For example, demographic questions such as age, income, or gender can be used to filter other questions. Breakouts allow you to segment a visualisation’s data, create a time series, or apply a breakout to the entire report.
○ Data Visualisation Settings
Customise report-wide settings, including the metric set (e.g., choice count, percentage of respondents), decimal places, color palette, font size and spacing, and which items are included by default (e.g., full question text in page titles, question numbers, response weighting, table totals, respondent counts, transposed stats tables, etc.). You can also choose the visualisation style for each question (chart, simple table, statistics table, etc.).
○ Overview of Visualisation Type
Explore all available visualisation formats in Qualtrics. You can also change the data source or metric for specific questions (e.g., count, percentage, mean).
○ Filtering Results
Apply filters to display only the results that meet specific criteria.
○ Sharing Results
Share your survey results with a colleague’s Qualtrics account, generate and share a digital copy of your report in PDF, Word, PowerPoint, or CSV format, or send your results report as an email attachment. - Survey Reports (Advanced Report)
The Reports function allows you to create detailed online and printed reports to share with stakeholders. You can customize the page layout, select visualization types, and apply filters to extract and present specific data criteria.
Documentations for Advanced Users
Documentations explaining the advanced features of Qualtrics:
- Survey Flow
Customise respondent pathways using these components:
○ Question Blocks: Organise questions into reusable groups and control their display order.
○ Branch Logic: Direct respondents to different paths based on conditions (e.g., terminating surveys if "Under 18" is selected).
○ Embedded Data: Attach metadata (e.g., demographics, source URLs) to responses using values from contact lists, URL parameters, or survey flow.
○ Randomizer: Randomise blocks, questions, or embedded data to counter order bias.
○ Text iQ-Powered Survey FlowsDynamically route respondents based on sentiment/topic analysis of open-ended responses.
○ Reference Surveys: Reuse question sets across projects without recreation.
- Workflows
Automate tasks using triggers:
○ Survey Response Event: Initiate actions (e.g., emails, API calls) when responses are submitted/updated.
○ Email Task: Auto-send notifications / alerts based on response data (e.g., new submission alerts).
- Advanced Tools
○ Authenticator: Verify respondent identities pre-survey.
○ End-of-Survey Customisation: Tailor completion messages/paths using embedded data or scoring.
○ Survey Flow Groups: Bundle flow elements for conditional execution.
○ Table of Contents: Enable respondent-driven navigation through blocks.
- Implementation Tips
○ Use recode values to align choice labels with statistical analysis needs.
○ Apply variable weighting to adjust question impact in composite scores.
○ Leverage API integrations for advanced security (IP allowlisting, mTLS) or external data pulls.
Documentations for Beginners
Documentation resources regarding the basic flow of building a Survey in Qualtrics:
- Project Basic Overview
The Projects page lists all the survey projects you have created and those that have been shared with you. The Projects page allows you to perform the following actions: 1) create new projects; 2) organise, sort, search, and view your projects; 3) collaborate / share on projects with colleagues; and 4) identify your projects by their project type.
- Survey Basic Overview
The surveys are created and edited in the survey builder. This document introduces the basics of using the Survey Builder to create (add) and edit survey questions, including what functions you can use to customise your questions.
--- Features when Editing Questions or Answer Choices ---
○ Rich Content Editor
It allows you to add special formatting to your text. Using this editor, you can bold, underline, change colors and fonts, add hyperlinks, add lists and tables, and even insert videos and images.
○ Pipe Text
Piped text is a line of code that allows you to dynamically pull text from a previous question, contact list information, or embedded data, and display it in the current question.
○ Auto-Number Questions
If you do not prefer editing each question number individually, or you would like all your question numbers to be in order, you can use Auto-Number Questions. This feature sequentially orders all the question numbers in your survey at once.
○ Adding Validation
Force response: Requires the respondent answer the question before they can continue the survey.
Request response: Alerts the respondent about any unanswered questions, but allows the respondent to continue the survey without answering if they choose.
Custom validation: Used to force a certain type of response, such as email address, telephone, numbers within range, etc.
○ Pre-Made Qualtrics Library Questions
In addition to providing survey templates, Qualtrics has saved some common questions you can put into almost any project’s survey, such as Demographics, or questions used in High Education, etc.
○ Adding Page Break
By default, your survey questions will be displayed together on one page. However, you can help prevent survey fatigue and improve your respondents’ experience by breaking your survey into multiple pages.
○ Previewing Question
You may choose to preview how a single question (question preview) or a block of questions (block preview) will look to your respondents without previewing the entire survey.
○ Suggested Choices
Qualtrics has suggested choices that can help you build questions. These contain answer choices for common survey questions, such as demographics or asking satisfaction on a standardised scale.
○ Additional Features to enhance Answer Choices
There’s a dropdown with lots of additional features that can enhance your choices, including "Allow Text Entry, Text Entry Size, and Text Entry Validation", "Rich Content Editor", "Insert Graphic", "Exclude From Analysis", "Insert Piped Text", "Add Display Logic", “Make Answer Exclusive”, and "Assign to Group".
--- Others: Basic Features ---
○ Skip Logic
Skip logic allows you to send respondents to a future point in the survey based on how they answer a question. For instance, if a respondent indicates that they don’t agree with your survey’s consent form, they could immediately be skipped to the end of the survey.
○ Display Logic
Display logic allows you to customise your survey for each respondent. You may apply "display logic" when a specific question or answer choice is relevant only to certain types of respondents. You can choose to conditionally display both questions and answer choices based on your respondent’s answers.
○ Editing the End of the Survey
If you want to customise your thank-you message, redirect them to another web page, or anonymise their response after your respondents finish taking your survey, you can use the end of survey settings to tailor the survey completion experience to your respondents.
--- Others: Advanced Features ---
○ Choice Randomisation
You can randomise the order in which your answer choices are presented.
○ Carry Forward Choices
Carry Forward Choices allows you to copy specific answer choices from one question for use in another question. For instance, you can ask your respondents to select multiple options they are in favour. You can then carry forward the choices they selected into the next question and ask them to rank their preference from those previously selected choices only.
○ Default Choices
You can use this feature to pre-populate answer choices within a question when the respondent opens the survey.
○ Recode Values
The recode value is the numeric value of a choice, whereas the variable name is the label of the choice when you export in choice text format. By default, the first answer choice will have a recode value of 1, the second choice 2, and so forth. These recode values and variable names are recorded in the collected dataset and you can modify them to align with your desired statistical analysis.
○ Scoring
If you are creating a quiz or a test using Qualtrics, you may need to use scoring. This feature gives you the ability to attach a point value to the answers of specific question types. These point values are summed up to give your respondent a final score.
--- Features for Final Checking ---
○ Previewing Survey
Once you have finished building your survey, you can preview it to ensure that everything is working the way you want.
○ Generate Test Responses
This function enables you to generate random dummy data. Therefore, you can see how your dataset or reports will look like before sending out your survey without completing the survey yourself repeatedly.
○ Setting Up Quotas of the Survey
Quotas allow you to keep track of how many respondents meet a condition in your survey.
○ Look & Feel
You customise the appearance of your survey in many different ways, including changing Survey Theme, Brand (logo, background image, header, and footer, etc.), Survey Layout, Specifying Questions per Page, Next and Back Button Text, Colours, Fonts, Survey Motion (e.g. Page Transition Animation, Survey Autoadvance, Autofocus), as well as adding a Progress Bar.
○ ExpertReview
ExpertReview is a digital reviewer for your surveys. It can measure the data quality of the survey elements (questions, logic, quotas, etc.), recommend how you should improve those elements and provide documentation for research-based explanations on these recommendations, as well as predict the quality of the data that will be collected.
○ Translating a Survey
You can add multiple languages to a single survey. Each respondent can see the survey in a language they are comfortable with. Since there is just one survey containing all the translations, all results will come back to the same dataset.
- Distributions of Survey
This document introduces how you can publish your survey using the Distribution Tab, what channel or method you can use to distribute your surveys to your target audiences (e.g. email distribution through anonymous link or traced link, web distribution, social media distribution, mobile distribution through SMS inviation, etc.), how to manage distributions, how to enable and pause survey responses, and more.
○ Vanity URLs
Vanity URLs are when the domain itself is modified, such as using hksyu.edu/research/survey/SV_1234567890. This allows to choose your own branding across multiple touchpoints, including survey links, dashboard invites, and more.
○ Email Distributions
You may use either the Qualtrics mailer or your own email system to send custom survey invitations. You may send reusable anonymous links or traceable personal links to distribute your surveys. You will need to create a contact list in order to use this method.
→ Reminder & Thank You Emails
After you’ve invited respondents to take your survey, Qualtrics allows you to send special emails reminding these respondents to finish, or thanking them for finishing.
○ SMS Distributions
You can also text an individualised link to your respondents via SMS. Since the link is individualised, it will save all the respondent’s contact information and their Embedded Data with their response.
○ Social Media Distributions
The Social Media section in the Distributions tab makes it easy to post your survey to social media websites. Qualtrics currently supports Twitter, Facebook, Reddit, LinkedIn, and Pinterest.
- Data & Analysis Basic Overview
It introduces the Data & Analysis tab which teaches you how to filter, classify, merge, clean, and statistically analyse your response data.
○ Text iQ
You may use Text iQ to tag text entry responses with topics for analysis. Additionally, the Text iQ search will help you pinpoint your topics. Lemmatization and spell check will also speed up your topic tagging.
○ Stats iQ
Stats iQ allows you dig deep into your analysis, identify trends, and produce predictive models.
○ Crosstabs
Crosstabs perform multivariate analysis (i.e., analysing 2 or more variables at a time) while calculating p-value, Chi-Square, and T-Test stats. Typically used with multiple choice and matrix table questions, you can also add embedded data to your crosstabs. Additionally, crosstabs include a variety of options that allow you to filter statistics, adjust the confidence level, and share your data with others.
- Survey Results (Simple Report)
It introduced the Results-reports tab which is designed to give you a quick and simple visualisation of your survey results. Each question in your survey will have a visualisation pre-made for it. This document also teaches you how to edit and add visuallisation to your results pages.
○ Breakouts
You can group your visualisations by multiple questions or fields using breakouts. For example, demographic questions for age, income, or gender can be used to filter other questions. Breakouts allows you to breakout a visualization’s data, create a Time Series or apply a breakout to the entire report.
○ Data Visualisation Settings
You may change the visualisation settings that apply to your whole report, including the metric set (e.g. choices count & percentage of respondents), how many decimal places are included in your report data, the colour palette used in your visualisations, the font size and spacing on your visualisations, which visualisation items are included in your report by default (e.g. full question text in page titles, question numbers, response weighting, simple table column totals, simple table respondent counts, transpose stats tables, etc.), and visualisation style of each question (chart, simple table and statistics table), etc.
○ Overview of Visualisation Type
It introduces all types of visualisation format available in the Qualtrics. You may also change the data source or the metric of the specific question (count, percentage, mean, etc.)
○ Filtering Results
You can use filters to refine results to show only results that meet specific criteria.
○ Sharing Results
You can share survey results with a colleague's Qualtrics account, generate and share a digital copy of your report in PDF, Word, PowerPoint, or CSV format, or send your results report as an email attachment.
- Survey Reports (Advanced Report)
You can use this function to create informative online and printed reports to share with your stakeholders. You can customise the page layout, type of visualisation and filters applied to extracting the specific criteria of your data.
Qualtrics provides over 100 different ways to ask a question, offering a wide variety of question types and settings to help you design surveys tailored to your research needs. Each question type comes with unique customization options.
Below is a brief overview of the main question types, with links to official Qualtrics documentation for more details:
If you are conducting survey research with human subjects, it is essential to obtain explicit consent from your participants before administering the survey.
Qualtrics Guide: Building a Consent Form
In Qualtrics, the typical survey flow for creating an informed consent statement is as follows:
- Display the informed consent statement to the participant.
- Ask the participant to confirm and record whether they consent or do not consent to participate.
- If the participant consents, proceed to the first page of survey questions.
- If the participant does not consent, direct them to the end of the survey.
There are several ways to implement this survey logic in Qualtrics, depending on your survey structure and research needs. The two most common approaches are using skip logic or branch logic.
Skip logic
Skip logic provides a straightforward, conditional path:
If a specific condition is met, then skip to a designated point in the survey.
Skip logic is ideal for simple survey structures where all participants who do not consent are directed to the same end-of-survey message or outcome.
Branch logic
Branch logic allows for more complex conditional flows:
If a specific condition is met, then direct the respondent to a particular branch or section of the survey.
Branch logic is best suited for surveys with multiple paths or when you want to customise the end-of-survey experience based on the participant’s consent decision. For example, you may wish to display a specific message such as “Thank you for your interest in this survey” to those who do not consent, and a different message such as “Thank you for completing this survey” to those who do.
Learning the Basic and the Advanced Features of Qualtrics
If you want to learn both the basic and advanced features of Qualtrics, there are comprehensive user guides and video tutorials available through the Institute of Higher Learning on Qualtrics Basecamp.
Course Description:
Learning Objectives:
- Understand the basics of what the Qualtrics platforms offer for research
- Become proficient in advanced research and analytics tools on Qualtrics
- Effectively leverage Qualtrics for administrative use cases
- Learn best practices in research methodology
Course Structure:
- Week 1: Platform Basics — Learn the essentials of building, distributing, and reporting on survey projects.
- Week 2: Advanced Research — Explore advanced survey features, text and statistical analysis, and specialised methodologies like Conjoint and Max/Diff.
- Additional modules cover dashboard building, customer experience, and strategy for research.
Note: To watch the video tutorials and access course materials, you must log in with your Qualtrics account.
Qualtrics Articles for Survey Tips
There are several official articles and expert resources available to help you learn survey tips and improve your research practice, including:
- Great Survey Questions: How to Write Them & Avoid Common Mistakes
Learn how to craft clear, unbiased questions and avoid common pitfalls such as leading or double-barreled questions, unclear response options, and unnecessary jargon. Key tips include using neutral language, focusing on closed-ended questions, and piloting your questionnaire with your target audience to remove ambiguity and bias. - Your Ultimate Guide to Questionnaires and How to Design a Good One
Follow step-by-step guidance on identifying research aims, defining your target respondents, and structuring your questionnaire for robust data collection. This includes advice on longitudinal vs. cross-sectional designs and leveraging validated instruments when possible. - Defining a New Era of Feedback
Explore how modern customer feedback systems are evolving, including the integration of AI, real-time feedback, omnichannel distribution, personalization, and predictive analytics to enhance response quality and business insights - Improve Data Quality by Using a Commitment Request Instead of Attention Checks
Discover evidence-based strategies for improving data quality. For example, Qualtrics research shows that asking respondents to commit to providing thoughtful answers is more effective than traditional attention checks in reducing low-quality responses. - Ethical Issues to Consider When Conducting Survey Research
Understand the importance of survey ethics, including obtaining informed consent, ensuring confidentiality and anonymity, and protecting participants’ well-being. Ethical surveys are transparent about their purpose and data usage, and avoid coercion or manipulation. - 5 Common Errors in the Research Process
Avoid frequent research mistakes such as unclear objectives, sampling bias, data collection errors, confirmation bias, and lack of reproducibility. Careful planning, attention to detail, and ethical rigour are essential for credible research. - Think You’re Sending Too Many Surveys? How to Avoid Survey Fatigue
Learn strategies to prevent survey fatigue, such as limiting survey frequency, keeping surveys concise, and ensuring each survey has a clear purpose. - Why Do People Participate as Respondents in a Survey?
Gain insights into respondent motivation, which can help you design more engaging surveys and improve response rates.
Learning Courses for Students & Faculties
- Planning and Designing a Survey
Learn how to define research objectives, develop effective survey questions, and structure your survey to ensure reliable and actionable data.
- Building a Survey Project
Gain practical skills in creating and organising surveys within Qualtrics, including adding questions, applying logic, and managing survey flow
- Distributing Survey Project
Explore various distribution methods such as email, anonymous links, and social media to effectively reach your target respondents.
- Understanding Survey Data
Develop the ability to manage, filter, and interpret survey responses using Qualtrics’ Data & Analysis tools for meaningful insights.
- Reporting Survey Results with Results Dashboards
Learn to visualize and present your survey findings using customisable dashboards and reporting features for clear and impactful communication.
Learning Courses for Faculties
- Platform Basics
Understand the core features and navigation of the Qualtrics platform, enabling efficient survey project management.
- Advanced Research
Delve into advanced survey logic, data analysis techniques, and research methodologies to support complex academic projects.
- Customising Survey Experiences
Master advanced customisation options such as display logic, branching, and branding to enhance respondent engagement and data quality.
- Distributing to Your Target Audiences
Learn targeted distribution strategies and contact management to maximise response rates and ensure data reliability.
- Exploring and Analysing Your Data
Utilise advanced analytics tools, including Text iQ and Stats iQ, to uncover trends and generate actionable research insights.
- Reporting on Your Insights
Develop comprehensive reports and dashboards to effectively communicate research outcomes to stakeholders and decision-makers.
Best Practices to Improve your Research Methodology
This series is designed to help researchers improve their survey response rates and insights:
- Designing your Research Process: Guide your organisation towards insights by breaking down problems to define research questions that can be solved with Qualtrics.
- Applying Best Practices in Questionnaire Design: Master the art of survey building by implementing fundamental best practices that all researchers must know in order to collect high quality data.
- Minimizing Survey Fatigue and Bias: Implement survey design best practices to collect high quality data by minimizing bias and respondent survey fatigue.
- Sampling the Right Audience: Ensure you distribute your survey to the optimal number of respondents from the right audience so you can be confident in your data.
- Driving Response Rates: Obtain the data you need by implementing survey design and distribution methods that drive high response rates.
Live Training Events by Qualtrics XM
- Live Training Events
Access the latest schedule of interactive live training sessions hosted by Qualtrics XM experts. These events cover a wide range of topics, from survey creation and distribution to advanced data analysis, and provide opportunities for real-time Q&A.
On-Demand Live Webinar
- APAC Qualtrics Onboarding Webinar: Your First Steps with Qualtrics Platform
An introductory webinar designed for new users in the Asia-Pacific region. Learn the essential functions of the Qualtrics platform, including account setup, survey building, and basic distribution methods.
- Learn Qualtrics Live (Pre-recorded Version: On-Demand Webinar - Learn Qualtrics)
A comprehensive, pre-recorded webinar covering the core features of Qualtrics. Ideal for users who prefer to learn at their own pace, this session includes step-by-step demonstrations on survey design, logic, data analysis, and reporting.